PNC Bank 2015 Annual Report Download - page 66
Download and view the complete annual report
Please find page 66 of the 2015 PNC Bank annual report below. You can navigate through the pages in the report by either clicking on the pages listed below, or by using the keyword search tool below to find specific information within the annual report.-
 1
1 -
2
-
3
-
4
-
5
-
6
-
7
-
8
-
9
-
10
-
11
-
12
-
13
-
14
-
15
-
16
-
17
-
18
-
19
-
20
-
21
-
22
-
23
-
24
-
25
-
26
-
27
-
28
-
29
-
30
-
31
-
32
-
33
-
34
-
35
-
36
-
37
-
38
-
39
-
40
-
41
-
42
-
43
-
44
-
45
-
46
-
47
-
48
-
49
-
50
-
51
-
52
-
53
-
54
-
55
-
 56
56 -
 57
57 -
 58
58 -
 59
59 -
 60
60 -
 61
61 -
 62
62 -
 63
63 -
 64
64 -
 65
65 -
 66
66 -
 67
67 -
 68
68 -
 69
69 -
 70
70 -
 71
71 -
 72
72 -
 73
73 -
 74
74 -
 75
75 -
 76
76 -
77
-
78
-
79
-
80
-
81
-
82
-
83
-
84
-
85
-
86
-
87
-
88
-
89
-
90
-
91
-
92
-
93
-
94
-
95
-
96
-
97
-
98
-
99
-
100
-
101
-
102
-
103
-
104
-
105
-
106
-
107
-
108
-
109
-
110
-
111
-
112
-
113
-
114
-
115
-
116
-
117
-
118
-
119
-
120
-
121
-
122
-
123
-
124
-
125
-
126
-
127
-
128
-
129
-
130
-
131
-
132
-
133
-
134
-
135
-
136
-
137
-
138
-
139
-
140
-
141
-
142
-
143
-
144
-
145
-
146
-
147
-
148
-
149
-
150
-
151
-
152
-
153
-
154
-
155
-
156
-
157
-
158
-
159
-
160
-
161
-
162
-
163
-
164
-
165
-
166
-
167
-
168
-
169
-
170
-
171
-
172
-
173
-
174
-
175
-
176
-
177
-
178
-
179
-
180
-
181
-
182
-
183
-
184
-
185
-
186
-
187
-
188
-
189
-
190
-
191
-
192
-
193
-
194
-
195
-
196
-
197
-
198
-
199
-
200
-
201
-
202
-
203
-
204
-
205
-
206
-
207
-
208
-
209
-
210
-
211
-
212
-
213
-
214
-
215
-
216
-
217
-
218
-
219
-
220
-
221
-
222
-
223
-
224
-
225
-
226
-
227
-
228
-
229
-
230
-
231
-
232
-
233
-
234
-
235
-
236
-
237
-
238
-
239
-
240
-
241
-
242
-
243
-
244
-
245
-
246
-
247
-
248
-
249
-
250
-
251
-
252
-
253
-
254
-
255
-
256
 |
 |

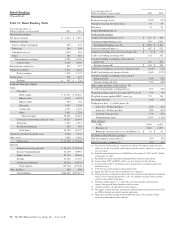
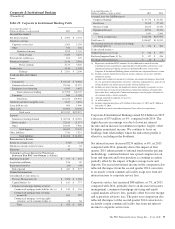
Table 19: Basel III Capital
December 31, 2015
Dollars in millions
Transitional
Basel III (a)
Pro forma Fully
Phased-In Basel
III (b)(c)
Common equity Tier 1 capital
Common stock plus related surplus, net of treasury stock $ 12,085 $ 12,085
Retained earnings 29,043 29,043
Accumulated other comprehensive income for securities currently and previously held as available for sale 141 353
Accumulated other comprehensive income for pension and other postretirement plans (222) (554)
Goodwill, net of associated deferred tax liabilities (8,839) (8,839)
Other disallowed intangibles, net of deferred tax liabilities (133) (333)
Other adjustments/(deductions) (112) (182)
Total common equity Tier 1 capital before threshold deductions 31,963 31,573
Total threshold deductions (470) (1,294)
Common equity Tier 1 capital 31,493 30,279
Additional Tier 1 capital
Preferred stock plus related surplus 3,452 3,452
Trust preferred capital securities 50
Noncontrolling interests (d) 604 44
Other adjustments/(deductions) (77) (109)
Tier 1 capital 35,522 33,666
Additional Tier 2 capital
Qualifying subordinated debt 4,597 4,253
Trust preferred capital securities 149
Allowance for loan and lease losses included in Tier 2 capital 2,988 2,988
Other 410
Total Basel III capital $ 43,260 $ 40,917
Risk-weighted assets
Basel III standardized approach risk-weighted assets (e) $295,905 $303,707
Estimated Basel III advanced approaches risk-weighted assets (f) N/A 264,931
Average quarterly adjusted total assets 350,143 349,020
Supplementary leverage exposure (g) 413,111 411,988
Basel III risk-based capital and leverage ratios
Common equity Tier 1 10.6% 10.0% (h)(i)
Tier 1 12.0 11.1 (h)(j)
Total 14.6 13.5 (h)(k)
Leverage (l) 10.1 9.6
Supplementary leverage ratio (m) 8.6 8.2
(a) Calculated using the regulatory capital methodology applicable to PNC during 2015.
(b) PNC utilizes the pro forma fully phased-in Basel III capital ratios to assess its capital position (without the benefit of phase-ins), including comparison to similar estimates made by
other financial institutions. Pro forma fully phased-in capital amounts, ratios and risk-weighted and leverage-related assets are estimated.
(c) Basel III capital ratios and estimates may be impacted by additional regulatory guidance or analysis and, in the case of those ratios calculated using the advanced approaches, the
ongoing evolution, validation and regulatory approval of PNC’s models integral to the calculation of advanced approaches risk-weighted assets.
(d) Primarily includes REIT preferred securities.
(e) Includes credit and market risk-weighted assets.
(f) Basel III advanced approaches risk-weighted assets were estimated based on the Basel III advanced approaches rules, and include credit, market and operational risk-weighted assets.
During the parallel run qualification phase PNC has refined the data, models and internal processes used as part of the advanced approaches for determining risk-weighted assets.
Refinements implemented in the fourth quarter of 2015 reduced estimated Basel III advanced approaches risk-weighted assets. We anticipate additional refinements may result in
increases or decreases to this estimate through the parallel run qualification phase.
(g) Supplementary leverage exposure is the sum of Adjusted average assets and certain off-balance sheet exposures including undrawn credit commitments and derivative potential future
exposures.
(h) Pro forma fully phased-in Basel III capital ratio based on estimated Basel III standardized approach risk-weighted assets and rules.
(i) For comparative purposes only, the pro forma fully phased-in advanced approaches Basel III Common equity Tier 1 capital ratio estimate is 11.4%. This capital ratio is calculated
using pro forma fully phased-in Common equity Tier 1 capital and dividing by estimated Basel III advanced approaches risk-weighted assets.
(j) For comparative purposes only, the pro forma fully phased-in advanced approaches Basel III Tier 1 risk-based capital ratio estimate is 12.7%. This capital ratio is calculated using
fully phased-in Tier 1 capital and dividing by estimated Basel III advanced approaches risk-weighted assets.
(k) For comparative purposes only, the pro forma fully phased-in advanced approaches Basel III Total capital risk-based capital ratio estimate is 14.3%. This ratio is calculated using fully
phased-in Total Basel III capital, which under the advanced approaches, Additional Tier 2 capital includes allowance for loan and leases losses in excess of Basel expected credit
losses, if any, up to 0.6% of credit risk-weighted assets, and dividing by estimated Basel III advanced approaches risk-weighted assets.
(l) Leverage ratio is calculated based on Tier 1 capital divided by Average quarterly adjusted total assets.
(m) Supplementary leverage ratio is calculated based on Tier 1 capital divided by Supplementary leverage exposure. As advanced approaches banking organizations, PNC and PNC Bank
will be subject to a 3% minimum supplementary leverage ratio effective January 1, 2018.
48 The PNC Financial Services Group, Inc. – Form 10-K