PNC Bank 2015 Annual Report Download - page 90
Download and view the complete annual report
Please find page 90 of the 2015 PNC Bank annual report below. You can navigate through the pages in the report by either clicking on the pages listed below, or by using the keyword search tool below to find specific information within the annual report.-
 1
1 -
2
-
3
-
4
-
5
-
6
-
7
-
8
-
9
-
10
-
11
-
12
-
13
-
14
-
15
-
16
-
17
-
18
-
19
-
20
-
21
-
22
-
23
-
24
-
25
-
26
-
27
-
28
-
29
-
30
-
31
-
32
-
33
-
34
-
35
-
36
-
37
-
38
-
39
-
40
-
41
-
42
-
43
-
44
-
45
-
46
-
47
-
48
-
49
-
50
-
51
-
52
-
53
-
54
-
55
-
56
-
57
-
58
-
59
-
60
-
61
-
62
-
63
-
64
-
65
-
66
-
67
-
68
-
69
-
70
-
71
-
72
-
73
-
74
-
75
-
76
-
77
-
78
-
79
-
 80
80 -
 81
81 -
 82
82 -
 83
83 -
 84
84 -
 85
85 -
 86
86 -
 87
87 -
 88
88 -
 89
89 -
 90
90 -
 91
91 -
 92
92 -
 93
93 -
 94
94 -
 95
95 -
 96
96 -
 97
97 -
 98
98 -
 99
99 -
 100
100 -
101
-
102
-
103
-
104
-
105
-
106
-
107
-
108
-
109
-
110
-
111
-
112
-
113
-
114
-
115
-
116
-
117
-
118
-
119
-
120
-
121
-
122
-
123
-
124
-
125
-
126
-
127
-
128
-
129
-
130
-
131
-
132
-
133
-
134
-
135
-
136
-
137
-
138
-
139
-
140
-
141
-
142
-
143
-
144
-
145
-
146
-
147
-
148
-
149
-
150
-
151
-
152
-
153
-
154
-
155
-
156
-
157
-
158
-
159
-
160
-
161
-
162
-
163
-
164
-
165
-
166
-
167
-
168
-
169
-
170
-
171
-
172
-
173
-
174
-
175
-
176
-
177
-
178
-
179
-
180
-
181
-
182
-
183
-
184
-
185
-
186
-
187
-
188
-
189
-
190
-
191
-
192
-
193
-
194
-
195
-
196
-
197
-
198
-
199
-
200
-
201
-
202
-
203
-
204
-
205
-
206
-
207
-
208
-
209
-
210
-
211
-
212
-
213
-
214
-
215
-
216
-
217
-
218
-
219
-
220
-
221
-
222
-
223
-
224
-
225
-
226
-
227
-
228
-
229
-
230
-
231
-
232
-
233
-
234
-
235
-
236
-
237
-
238
-
239
-
240
-
241
-
242
-
243
-
244
-
245
-
246
-
247
-
248
-
249
-
250
-
251
-
252
-
253
-
254
-
255
-
256
 |
 |

Asset Quality Overview
Asset quality trends improved overall during 2015.
• Nonperforming assets at December 31, 2015
decreased $455 million compared with December 31,
2014 as a result of improvements in both consumer
lending and commercial lending nonperforming
loans. Consumer lending nonperforming loans
decreased $303 million and commercial lending
nonperforming loans decreased $81 million.
Nonperforming assets were 0.68% of total assets at
December 31, 2015 compared with 0.83% at
December 31, 2014.
• Overall loan delinquencies totaled $1.6 billion at
December 31, 2015, a decrease of $306 million, or
16%, from year-end 2014. The reduction was due in
large part to a reduction in accruing government
insured residential real estate loans past due 90 days
or more of $174 million, the majority of which we
took possession of and conveyed the real estate, or
are in the process of conveyance and claim
resolution.
• Net charge-offs were $386 million in 2015, down
27%, or $145 million, from net charge-offs in 2014.
• Provision for credit losses for the year ended
December 31, 2015 declined to $255 million
compared to $273 million for the year ended
December 31, 2014.
• The level of ALLL decreased to $2.7 billion at
December 31, 2015 as compared to $3.3 billion at
December 31, 2014, primarily due to a change to our
derecognition policy effective December 31, 2015 for
purchased impaired pooled consumer and residential
real estate loans.
Nonperforming Assets and Loan Delinquencies
Nonperforming Assets, including OREO and Foreclosed Assets
Nonperforming assets include nonperforming loans and leases
for which ultimate collectability of the full amount of
contractual principal and interest is not probable and include
nonperforming troubled debt restructurings (TDRs), OREO
and foreclosed assets. Loans held for sale, certain government
insured or guaranteed loans, purchased impaired loans and
loans accounted for under the fair value option are excluded
from nonperforming loans. Additional information regarding
our nonperforming loans and nonaccrual policies is included
in Note 1 Accounting Policies in the Notes To Consolidated
Financial Statements in Item 8 of this Report. A summary of
the major categories of nonperforming assets are presented in
Table 28. See Note 3 Asset Quality in the Notes To
Consolidated Financial Statements in Item 8 of this Report for
further detail of nonperforming asset categories.
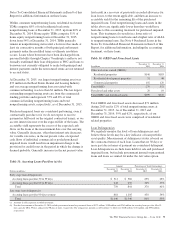
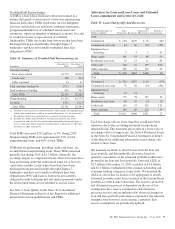
Table 28: Nonperforming Assets By Type
Dollars in millions
December 31
2015
December 31
2014
Nonperforming loans
Commercial lending $ 545 $ 626
Consumer lending (a)(b) 1,581 1,884
Total nonperforming loans (c) 2,126 2,510
OREO and foreclosed assets 299 370
Total nonperforming assets $2,425 $2,880
Amount of TDRs included in
nonperforming loans $1,119 $1,370
Percentage of total nonperforming loans 53% 55%
Nonperforming loans to total loans 1.03% 1.23%
Nonperforming assets to total loans,
OREO and foreclosed assets 1.17 1.40
Nonperforming assets to total assets .68 .83
Allowance for loan and lease losses to
total nonperforming loans (d) 128 133
(a) Excludes most consumer loans and lines of credit, not secured by residential real
estate, which are charged off after 120 to 180 days past due and are not placed on
nonperforming status.
(b) The recorded investment of loans collateralized by residential real estate property
that are in process of foreclosure was $.6 billion and $.8 billion at December 31,
2015 and December 31, 2014, respectively, and included $.3 billion and $.5 billion,
respectively, of loans that are government insured/guaranteed.
(c) Nonperforming loans exclude certain government insured or guaranteed loans, loans
held for sale, loans accounted for under the fair value option and purchased impaired
loans.
(d) The December 31, 2015 ratio was impacted by the change in derecognition policy
for purchased impaired pooled consumer and residential real estate loans as of
December 31, 2015. For additional information see Note 4 Purchased Loans in the
Notes To Consolidated Financial Statements in Item 8 of this Report.
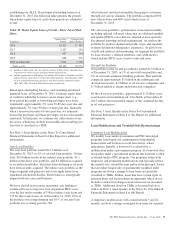
Table 29: Change in Nonperforming Assets
In millions 2015 2014
January 1 $2,880 $ 3,457
New nonperforming assets 1,459 2,127
Charge-offs and valuation adjustments (499) (585)
Principal activity, including paydowns and
payoffs (687) (1,001)
Asset sales and transfers to loans held for sale (364) (570)
Returned to performing status (364) (548)
December 31 $2,425 $ 2,880
Nonperforming assets decreased $455 million at
December 31, 2015 compared to December 31, 2014.
Consumer lending nonperforming loans decreased $303
million and commercial lending nonperforming loans
decreased $81 million. As of December 31, 2015,
approximately 90% of total nonperforming loans were secured
by collateral which lessens reserve requirements and is
expected to reduce credit losses in the event of default. As of
December 31, 2015, commercial lending nonperforming loans
were carried at approximately 62% of their unpaid principal
balance, due to charge-offs recorded to date, before
consideration of the ALLL. See Note 3 Asset Quality in the
72 The PNC Financial Services Group, Inc. – Form 10-K