PNC Bank 2015 Annual Report Download - page 193
Download and view the complete annual report
Please find page 193 of the 2015 PNC Bank annual report below. You can navigate through the pages in the report by either clicking on the pages listed below, or by using the keyword search tool below to find specific information within the annual report.-
 1
1 -
2
-
3
-
4
-
5
-
6
-
7
-
8
-
9
-
10
-
11
-
12
-
13
-
14
-
15
-
16
-
17
-
18
-
19
-
20
-
21
-
22
-
23
-
24
-
25
-
26
-
27
-
28
-
29
-
30
-
31
-
32
-
33
-
34
-
35
-
36
-
37
-
38
-
39
-
40
-
41
-
42
-
43
-
44
-
45
-
46
-
47
-
48
-
49
-
50
-
51
-
52
-
53
-
54
-
55
-
56
-
57
-
58
-
59
-
60
-
61
-
62
-
63
-
64
-
65
-
66
-
67
-
68
-
69
-
70
-
71
-
72
-
73
-
74
-
75
-
76
-
77
-
78
-
79
-
80
-
81
-
82
-
83
-
84
-
85
-
86
-
87
-
88
-
89
-
90
-
91
-
92
-
93
-
94
-
95
-
96
-
97
-
98
-
99
-
100
-
101
-
102
-
103
-
104
-
105
-
106
-
107
-
108
-
109
-
110
-
111
-
112
-
113
-
114
-
115
-
116
-
117
-
118
-
119
-
120
-
121
-
122
-
123
-
124
-
125
-
126
-
127
-
128
-
129
-
130
-
131
-
132
-
133
-
134
-
135
-
136
-
137
-
138
-
139
-
140
-
141
-
142
-
143
-
144
-
145
-
146
-
147
-
148
-
149
-
150
-
151
-
152
-
153
-
154
-
155
-
156
-
157
-
158
-
159
-
160
-
161
-
162
-
163
-
164
-
165
-
166
-
167
-
168
-
169
-
170
-
171
-
172
-
173
-
174
-
175
-
176
-
177
-
178
-
179
-
180
-
181
-
182
-
 183
183 -
 184
184 -
 185
185 -
 186
186 -
 187
187 -
 188
188 -
 189
189 -
 190
190 -
 191
191 -
 192
192 -
 193
193 -
 194
194 -
 195
195 -
 196
196 -
 197
197 -
 198
198 -
 199
199 -
 200
200 -
 201
201 -
 202
202 -
 203
203 -
204
-
205
-
206
-
207
-
208
-
209
-
210
-
211
-
212
-
213
-
214
-
215
-
216
-
217
-
218
-
219
-
220
-
221
-
222
-
223
-
224
-
225
-
226
-
227
-
228
-
229
-
230
-
231
-
232
-
233
-
234
-
235
-
236
-
237
-
238
-
239
-
240
-
241
-
242
-
243
-
244
-
245
-
246
-
247
-
248
-
249
-
250
-
251
-
252
-
253
-
254
-
255
-
256
 |
 |

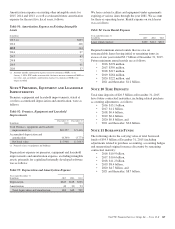
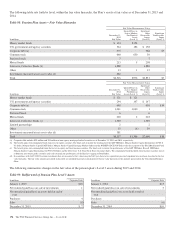
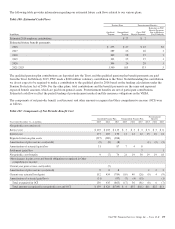
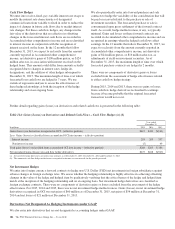
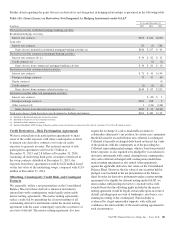
The following table provides information regarding our estimated future cash flows related to our various plans.
Table 100: Estimated Cash Flows
Pension Plans Postretirement Benefits
In millions
Qualified
Pension
Nonqualified
Pension
Gross PNC
Benefit Payments
Reduction in PNC
Benefit Payments
Due to Medicare
Part D Subsidy
Estimated 2016 employer contributions $ 27 $ 2
Estimated future benefit payments
2016 $ 273 $ 27 $ 25 $1
2017 289 26 26 1
2018 305 28 27 1
2019 303 25 27 1
2020 304 24 28 1
2021-2025 1,560 105 133 5
The qualified pension plan contributions are deposited into the Trust, and the qualified pension plan benefit payments are paid
from the Trust. In February 2015, PNC made a $200 million voluntary contribution to the Trust. Notwithstanding the contribution,
we do not expect to be required to make a contribution to the qualified plan for 2016 based on the funding calculations under the
Pension Protection Act of 2006. For the other plans, total contributions and the benefit payments are the same and represent
expected benefit amounts, which are paid from general assets. Postretirement benefits are net of participant contributions.
Estimated cash flows reflect the partial funding of postretirement medical and life insurance obligations in the VEBA.
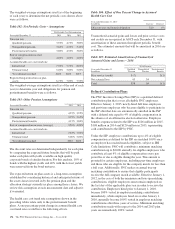
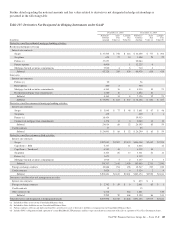
The components of net periodic benefit cost/(income) and other amounts recognized in Other comprehensive income (OCI) were
as follows.
Table 101: Components of Net Periodic Benefit Cost
Qualified Pension Plan Nonqualified Pension Plan
Postretirement
Benefits
Year ended December 31 – in millions 2015 2014 2013 2015 2014 2013 2015 2014 2013
Net periodic cost consists of:
Service cost $ 107 $ 103 $ 113 $ 3 $ 3 $ 3 $ 5 $ 5 $ 6
Interest cost 177 187 170 11 12 12 15 16 14
Expected return on plan assets (297) (289) (288)
Amortization of prior service cost/(credit) (9) (8) (8) (1) (2) (3)
Amortization of actuarial (gain)/loss 31 87748
Settlement (gain)/loss 71
Net periodic cost (benefit) 9 (7) 74 21 19 30 19 19 18
Other changes in plan assets and benefit obligations recognized in Other
comprehensive income:
Current year prior service cost/(credit) (7)
Amortization of prior service (cost)/credit 9 8 8 1 2 3
Current year actuarial loss/(gain) 152 434 (784) (10) 40 (26) (9) 4 (9)
Amortization of actuarial gain/(loss) (31) (87) (7) (4) (15) (1)
Total recognized in OCI 130 435 (863) (17) 36 (41) (8) 6 (7)
Total amounts recognized in net periodic cost and OCI $ 139 $ 428 $(789) $ 4 $55 $(11) $11 $25 $11
The PNC Financial Services Group, Inc. – Form 10-K 175