PNC Bank 2015 Annual Report Download - page 194
Download and view the complete annual report
Please find page 194 of the 2015 PNC Bank annual report below. You can navigate through the pages in the report by either clicking on the pages listed below, or by using the keyword search tool below to find specific information within the annual report.-
 1
1 -
2
-
3
-
4
-
5
-
6
-
7
-
8
-
9
-
10
-
11
-
12
-
13
-
14
-
15
-
16
-
17
-
18
-
19
-
20
-
21
-
22
-
23
-
24
-
25
-
26
-
27
-
28
-
29
-
30
-
31
-
32
-
33
-
34
-
35
-
36
-
37
-
38
-
39
-
40
-
41
-
42
-
43
-
44
-
45
-
46
-
47
-
48
-
49
-
50
-
51
-
52
-
53
-
54
-
55
-
56
-
57
-
58
-
59
-
60
-
61
-
62
-
63
-
64
-
65
-
66
-
67
-
68
-
69
-
70
-
71
-
72
-
73
-
74
-
75
-
76
-
77
-
78
-
79
-
80
-
81
-
82
-
83
-
84
-
85
-
86
-
87
-
88
-
89
-
90
-
91
-
92
-
93
-
94
-
95
-
96
-
97
-
98
-
99
-
100
-
101
-
102
-
103
-
104
-
105
-
106
-
107
-
108
-
109
-
110
-
111
-
112
-
113
-
114
-
115
-
116
-
117
-
118
-
119
-
120
-
121
-
122
-
123
-
124
-
125
-
126
-
127
-
128
-
129
-
130
-
131
-
132
-
133
-
134
-
135
-
136
-
137
-
138
-
139
-
140
-
141
-
142
-
143
-
144
-
145
-
146
-
147
-
148
-
149
-
150
-
151
-
152
-
153
-
154
-
155
-
156
-
157
-
158
-
159
-
160
-
161
-
162
-
163
-
164
-
165
-
166
-
167
-
168
-
169
-
170
-
171
-
172
-
173
-
174
-
175
-
176
-
177
-
178
-
179
-
180
-
181
-
182
-
183
-
 184
184 -
 185
185 -
 186
186 -
 187
187 -
 188
188 -
 189
189 -
 190
190 -
 191
191 -
 192
192 -
 193
193 -
 194
194 -
 195
195 -
 196
196 -
 197
197 -
 198
198 -
 199
199 -
 200
200 -
 201
201 -
 202
202 -
 203
203 -
 204
204 -
205
-
206
-
207
-
208
-
209
-
210
-
211
-
212
-
213
-
214
-
215
-
216
-
217
-
218
-
219
-
220
-
221
-
222
-
223
-
224
-
225
-
226
-
227
-
228
-
229
-
230
-
231
-
232
-
233
-
234
-
235
-
236
-
237
-
238
-
239
-
240
-
241
-
242
-
243
-
244
-
245
-
246
-
247
-
248
-
249
-
250
-
251
-
252
-
253
-
254
-
255
-
256
 |
 |

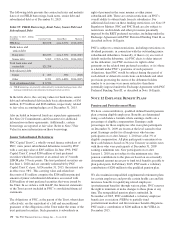
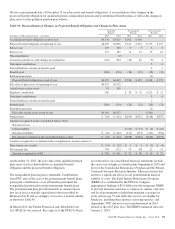
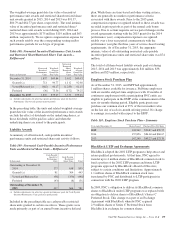
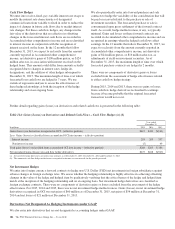
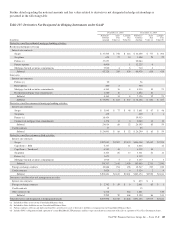
The weighted-average assumptions used (as of the beginning
of each year) to determine the net periodic costs shown above
were as follows.
Table 102: Net Periodic Costs – Assumptions
Net Periodic Cost Determination
Year ended December 31 2015 2014 2013
Discount rate
Qualified pension 3.95% 4.75% 3.80%
Nonqualified pension 3.65% 4.35% 3.45%
Postretirement benefits 3.80% 4.50% 3.60%
Rate of compensation increase
(average) 4.00% 4.00% 4.00%
Assumed health care cost trend rate
Initial trend 7.50% 7.75% 8.00%
Ultimate trend 5.00% 5.00% 5.00%
Year ultimate reached 2025 2025 2019
Expected long-term return on plan
assets 6.75% 7.00% 7.50%
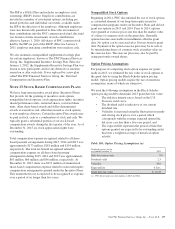
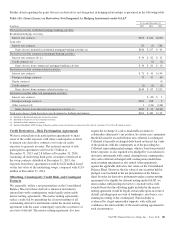
The weighted-average assumptions used (as of the end of each
year) to determine year end obligations for pension and
postretirement benefits were as follows.
Table 103: Other Pension Assumptions
Year ended December 31 2015 2014
Discount rate
Qualified pension 4.25% 3.95%
Nonqualified pension 3.95% 3.65%
Postretirement benefits 4.15% 3.80%
Rate of compensation increase (average) 3.50% 4.00%
Assumed health care cost trend rate
Initial trend 7.25% 7.50%
Ultimate trend 5.00% 5.00%
Year ultimate reached 2025 2025
The discount rates are determined independently for each plan
by comparing the expected future benefits that will be paid
under each plan with yields available on high quality
corporate bonds of similar duration. For this analysis, 10% of
bonds with the highest yields and 40% with the lowest yields
were removed from the bond universe.
The expected return on plan assets is a long-term assumption
established by considering historical and anticipated returns of
the asset classes invested in by the pension plan and the
allocation strategy currently in place among those classes. We
review this assumption at each measurement date and adjust it
if warranted.
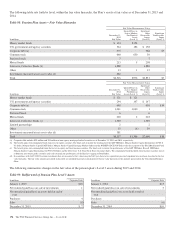
The health care cost trend rate assumptions shown in the
preceding tables relate only to the postretirement benefit
plans. A one-percentage-point change in assumed health care
cost trend rates would have the following effects.
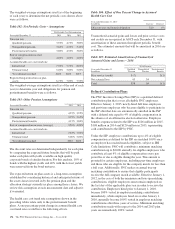
Table 104: Effect of One Percent Change in Assumed
Health Care Cost
Year ended December 31, 2015
In millions Increase Decrease
Effect on year end benefit obligation $10 (9)
Unamortized actuarial gains and losses and prior service costs
and credits are recognized in AOCI each December 31, with
amortization of these amounts through net periodic benefit
cost. The estimated amounts that will be amortized in 2016 are
as follows.
Table 105: Estimated Amortization of Unamortized
Actuarial Gains and Losses – 2016
2016 Estimate
Year ended December 31
In millions
Qualified
Pension
Nonqualified
Pension
Postretirement
Benefits
Prior service (credit) $ (7) $(1)
Net actuarial loss 45 $4
Total $38 $4 $(1)
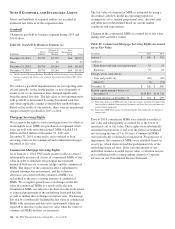
Defined Contribution Plans
The PNC Incentive Savings Plan (ISP) is a qualified defined
contribution plan that covers all eligible PNC employees.
Effective January 1, 2015, newly-hired full time employees
and part-time employees who became eligible to participate in
the ISP after that date are automatically enrolled in the ISP
with a deferral rate equal to 4% of eligible compensation in
the absence of an affirmative election otherwise. Employee
benefits expense related to the ISP was $126 million in 2015,
$108 million in 2014 and $120 million in 2013, representing
cash contributed to the ISP by PNC.
Under the ISP, employee contributions up to 4% of eligible
compensation as defined by the ISP are matched 100% once
an employee has reached match-eligibility, subject to IRS
Code limitations. PNC will contribute a minimum matching
contribution up to $2,000 annually for eligible employees who
contribute at least 4% of eligible compensation every pay
period he or she is eligible during the year. This amount is
prorated for certain employees, including part-time employees
and those who are eligible for the company match for less than
a full year. Additionally, PNC makes an annual true-up
matching contribution to ensure that eligible participants
receive the full company match available. Effective January 1,
2012, in the case of both the minimum and true-up matching
contributions, eligible employees must remain employed on
the last day of the applicable plan year in order to receive the
contribution. Employees hired prior to January 1, 2010,
became 100% vested in employer matching contributions
immediately, while employees hired on or after January 1,
2010, generally become 100% vested in employer matching
contributions after three years of service. Minimum matching
contributions made with respect to the 2014 and 2013 plan
years are immediately 100% vested.
176 The PNC Financial Services Group, Inc. – Form 10-K