PNC Bank 2015 Annual Report Download - page 56
Download and view the complete annual report
Please find page 56 of the 2015 PNC Bank annual report below. You can navigate through the pages in the report by either clicking on the pages listed below, or by using the keyword search tool below to find specific information within the annual report.-
 1
1 -
2
-
3
-
4
-
5
-
6
-
7
-
8
-
9
-
10
-
11
-
12
-
13
-
14
-
15
-
16
-
17
-
18
-
19
-
20
-
21
-
22
-
23
-
24
-
25
-
26
-
27
-
28
-
29
-
30
-
31
-
32
-
33
-
34
-
35
-
36
-
37
-
38
-
39
-
40
-
41
-
42
-
43
-
44
-
45
-
 46
46 -
 47
47 -
 48
48 -
 49
49 -
 50
50 -
 51
51 -
 52
52 -
 53
53 -
 54
54 -
 55
55 -
 56
56 -
 57
57 -
 58
58 -
 59
59 -
 60
60 -
 61
61 -
 62
62 -
 63
63 -
 64
64 -
 65
65 -
 66
66 -
67
-
68
-
69
-
70
-
71
-
72
-
73
-
74
-
75
-
76
-
77
-
78
-
79
-
80
-
81
-
82
-
83
-
84
-
85
-
86
-
87
-
88
-
89
-
90
-
91
-
92
-
93
-
94
-
95
-
96
-
97
-
98
-
99
-
100
-
101
-
102
-
103
-
104
-
105
-
106
-
107
-
108
-
109
-
110
-
111
-
112
-
113
-
114
-
115
-
116
-
117
-
118
-
119
-
120
-
121
-
122
-
123
-
124
-
125
-
126
-
127
-
128
-
129
-
130
-
131
-
132
-
133
-
134
-
135
-
136
-
137
-
138
-
139
-
140
-
141
-
142
-
143
-
144
-
145
-
146
-
147
-
148
-
149
-
150
-
151
-
152
-
153
-
154
-
155
-
156
-
157
-
158
-
159
-
160
-
161
-
162
-
163
-
164
-
165
-
166
-
167
-
168
-
169
-
170
-
171
-
172
-
173
-
174
-
175
-
176
-
177
-
178
-
179
-
180
-
181
-
182
-
183
-
184
-
185
-
186
-
187
-
188
-
189
-
190
-
191
-
192
-
193
-
194
-
195
-
196
-
197
-
198
-
199
-
200
-
201
-
202
-
203
-
204
-
205
-
206
-
207
-
208
-
209
-
210
-
211
-
212
-
213
-
214
-
215
-
216
-
217
-
218
-
219
-
220
-
221
-
222
-
223
-
224
-
225
-
226
-
227
-
228
-
229
-
230
-
231
-
232
-
233
-
234
-
235
-
236
-
237
-
238
-
239
-
240
-
241
-
242
-
243
-
244
-
245
-
246
-
247
-
248
-
249
-
250
-
251
-
252
-
253
-
254
-
255
-
256
 |
 |

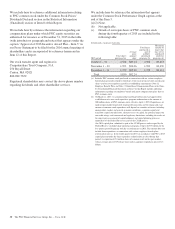
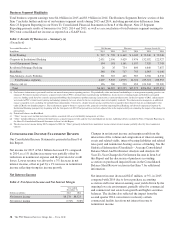
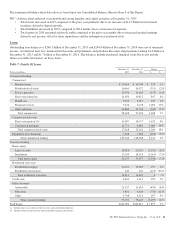
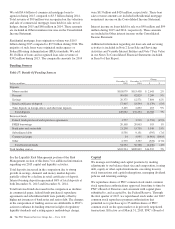
Business Segment Highlights
Total business segment earnings were $4.0 billion in 2015 and $3.9 billion in 2014. The Business Segments Review section of this
Item 7 includes further analysis of our business segment results during 2015 and 2014, including presentation differences from
Note 23 Segment Reporting in our Notes To Consolidated Financial Statements in Item 8 of this Report. Note 23 Segment
Reporting presents results of businesses for 2015, 2014 and 2013, as well as a reconciliation of total business segment earnings to
PNC total consolidated net income as reported on a GAAP basis.
Table 3: Results Of Businesses – Summary (a)
(Unaudited)
Year ended December 31 Net Income Revenue Average Assets (b)
In millions 2015 2014 2015 2014 2015 2014
Retail Banking $ 907 $ 728 $ 6,449 $ 6,049 $ 73,240 $ 75,046
Corporate & Institutional Banking 2,031 2,106 5,429 5,476 132,032 122,927
Asset Management Group 194 181 1,161 1,107 7,920 7,745
Residential Mortgage Banking 26 35 734 800 6,840 7,857
BlackRock 548 530 717 703 6,983 6,640
Non-Strategic Assets Portfolio 301 367 445 587 6,706 8,338
Total business segments 4,007 3,947 14,935 14,722 233,721 228,553
Other (c) (d) (e) 136 260 290 653 121,243 99,300
Total $4,143 $4,207 $15,225 $15,375 $354,964 $327,853
(a) Our business information is presented based on our internal management reporting practices. We periodically refine our internal methodologies as management reporting practices are
enhanced. Net interest income in business segment results reflects PNC’s internal funds transfer pricing methodology. Assets receive a funding charge and liabilities and capital
receive a funding credit based on a transfer pricing methodology that incorporates product repricing characteristics, tenor and other factors. In the first quarter of 2015, enhancements
were made to PNC’s funds transfer pricing methodology primarily for costs related to the new regulatory short-term liquidity standards. The enhancements incorporate an additional
charge assigned to assets, including for unfunded loan commitments. Conversely, a higher transfer pricing credit has been assigned to those deposits that are accorded higher value
under LCR rules for liquidity purposes. These adjustments apply to business segment results, primarily favorably impacting Retail Banking and adversely impacting Corporate &
Institutional Banking, prospectively beginning with the first quarter of 2015. Prior periods have not been adjusted due to the impracticability of estimating the impact of the change for
prior periods.
(b) Period-end balances for BlackRock.
(c) “Other” average assets include investment securities associated with asset and liability management activities.
(d) “Other” includes differences between the total business segment financial results and our total consolidated net income. Additional detail is included in Note 23 Segment Reporting in
the Notes To Consolidated Financial Statements in Item 8 of this Report.
(e) The decrease in net income during 2015 compared to 2014 for “Other” primarily reflected lower noninterest income and net interest income, partially offset by lower noninterest
expense.
C
ONSOLIDATED
I
NCOME
S
TATEMENT
R
EVIEW
Our Consolidated Income Statement is presented in Item 8 of
this Report.
Net income for 2015 of $4.1 billion decreased 2% compared
to 2014, as a 1% decline in revenue was partially offset by
reductions in noninterest expense and the provision for credit
losses. Lower revenue was driven by a 3% decrease in net
interest income, offset in part by a 1% increase in noninterest
income reflecting strong fee income growth.
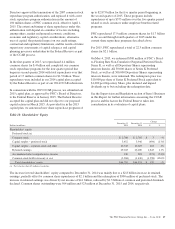
Net Interest Income
Table 4: Net Interest Income and Net Interest Margin
Year ended
December 31
Dollars in millions 2015 2014
Net interest income $8,278 $8,525
Net interest margin 2.74% 3.08%
Changes in net interest income and margin result from the
interaction of the volume and composition of interest-earning
assets and related yields, interest-bearing liabilities and related
rates paid, and noninterest-bearing sources of funding. See the
Statistical Information (Unaudited) – Average Consolidated
Balance Sheet And Net Interest Analysis and Analysis Of
Year-To-Year Changes In Net Interest Income in Item 8 of
this Report and the discussion of purchase accounting
accretion on purchased impaired loans in the Consolidated
Balance Sheet Review section in this Item 7 for additional
information.
Net interest income decreased $247 million, or 3%, in 2015
compared with 2014 due to lower purchase accounting
accretion and lower interest-earning asset yields driven by the
ongoing low rate environment, partially offset by commercial
and commercial real estate loan growth and higher securities
balances. The decline also reflected the impact from the
second quarter 2014 correction to reclassify certain
commercial facility fees from net interest income to
noninterest income.
38 The PNC Financial Services Group, Inc. – Form 10-K