PNC Bank 2015 Annual Report Download - page 146
Download and view the complete annual report
Please find page 146 of the 2015 PNC Bank annual report below. You can navigate through the pages in the report by either clicking on the pages listed below, or by using the keyword search tool below to find specific information within the annual report.-
 1
1 -
2
-
3
-
4
-
5
-
6
-
7
-
8
-
9
-
10
-
11
-
12
-
13
-
14
-
15
-
16
-
17
-
18
-
19
-
20
-
21
-
22
-
23
-
24
-
25
-
26
-
27
-
28
-
29
-
30
-
31
-
32
-
33
-
34
-
35
-
36
-
37
-
38
-
39
-
40
-
41
-
42
-
43
-
44
-
45
-
46
-
47
-
48
-
49
-
50
-
51
-
52
-
53
-
54
-
55
-
56
-
57
-
58
-
59
-
60
-
61
-
62
-
63
-
64
-
65
-
66
-
67
-
68
-
69
-
70
-
71
-
72
-
73
-
74
-
75
-
76
-
77
-
78
-
79
-
80
-
81
-
82
-
83
-
84
-
85
-
86
-
87
-
88
-
89
-
90
-
91
-
92
-
93
-
94
-
95
-
96
-
97
-
98
-
99
-
100
-
101
-
102
-
103
-
104
-
105
-
106
-
107
-
108
-
109
-
110
-
111
-
112
-
113
-
114
-
115
-
116
-
117
-
118
-
119
-
120
-
121
-
122
-
123
-
124
-
125
-
126
-
127
-
128
-
129
-
130
-
131
-
132
-
133
-
134
-
135
-
 136
136 -
 137
137 -
 138
138 -
 139
139 -
 140
140 -
 141
141 -
 142
142 -
 143
143 -
 144
144 -
 145
145 -
 146
146 -
 147
147 -
 148
148 -
 149
149 -
 150
150 -
 151
151 -
 152
152 -
 153
153 -
 154
154 -
 155
155 -
 156
156 -
157
-
158
-
159
-
160
-
161
-
162
-
163
-
164
-
165
-
166
-
167
-
168
-
169
-
170
-
171
-
172
-
173
-
174
-
175
-
176
-
177
-
178
-
179
-
180
-
181
-
182
-
183
-
184
-
185
-
186
-
187
-
188
-
189
-
190
-
191
-
192
-
193
-
194
-
195
-
196
-
197
-
198
-
199
-
200
-
201
-
202
-
203
-
204
-
205
-
206
-
207
-
208
-
209
-
210
-
211
-
212
-
213
-
214
-
215
-
216
-
217
-
218
-
219
-
220
-
221
-
222
-
223
-
224
-
225
-
226
-
227
-
228
-
229
-
230
-
231
-
232
-
233
-
234
-
235
-
236
-
237
-
238
-
239
-
240
-
241
-
242
-
243
-
244
-
245
-
246
-
247
-
248
-
249
-
250
-
251
-
252
-
253
-
254
-
255
-
256
 |
 |

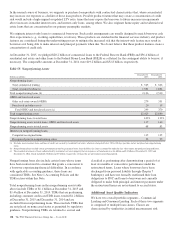
In the normal course of business, we originate or purchase loan products with contractual characteristics that, when concentrated,
may increase our exposure as a holder of those loan products. Possible product features that may create a concentration of credit
risk would include a high original or updated LTV ratio, terms that may expose the borrower to future increases in repayments
above increases in market interest rates, and interest-only loans, among others. We also originate home equity and residential real
estate loans that are concentrated in our primary geographic markets.
We originate interest-only loans to commercial borrowers. Such credit arrangements are usually designed to match borrower cash
flow expectations (e.g., working capital lines, revolvers). These products are standard in the financial services industry and product
features are considered during the underwriting process to mitigate the increased risk that the interest-only feature may result in
borrowers not being able to make interest and principal payments when due. We do not believe that these product features create a
concentration of credit risk.
At December 31, 2015, we pledged $20.2 billion of commercial loans to the Federal Reserve Bank (FRB) and $56.4 billion of
residential real estate and other loans to the Federal Home Loan Bank (FHLB) as collateral for the contingent ability to borrow, if
necessary. The comparable amounts at December 31, 2014 were $19.2 billion and $52.8 billion, respectively.
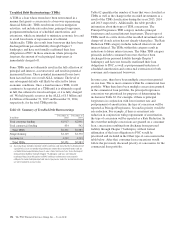
Table 55: Nonperforming Assets
Dollars in millions
December 31
2015
December 31
2014
Nonperforming loans
Total commercial lending $ 545 $ 626
Total consumer lending (a) 1,581 1,884
Total nonperforming loans (b) 2,126 2,510
OREO and foreclosed assets
Other real estate owned (OREO) 279 351
Foreclosed and other assets 20 19
Total OREO and foreclosed assets (c) 299 370
Total nonperforming assets $2,425 $2,880
Nonperforming loans to total loans 1.03% 1.23%
Nonperforming assets to total loans, OREO and foreclosed assets 1.17 1.40
Nonperforming assets to total assets .68 .83
Interest on nonperforming loans
Computed on original terms 115 125
Recognized prior to nonperforming status 22 25
(a) Excludes most consumer loans and lines of credit, not secured by residential real estate, which are charged off after 120 to 180 days past due and are not placed on nonperforming
status.
(b) Nonperforming loans exclude certain government insured or guaranteed loans, loans held for sale, loans accounted for under the fair value option and purchased impaired loans.
(c) The recorded investment of loans collateralized by residential real estate property that are in process of foreclosure was $.6 billion and $.8 billion at December 31, 2015 and
December 31, 2014, which included $.3 billion and $.5 billion, respectively, of loans that are government insured/guaranteed.
Nonperforming loans also include certain loans whose terms
have been restructured in a manner that grants a concession to
a borrower experiencing financial difficulties. In accordance
with applicable accounting guidance, these loans are
considered TDRs. See Note 1 Accounting Policies and the
TDR section within this Note.
Total nonperforming loans in the nonperforming assets table
above include TDRs of $1.1 billion at December 31, 2015 and
$1.4 billion at December 31, 2014. TDRs that are performing,
including consumer credit card TDR loans, totaled $1.2 billion
at December 31, 2015 and December 31, 2014 and are
excluded from nonperforming loans. These include TDRs that
are not placed on nonaccrual status as permitted by regulatory
guidance. Nonperforming TDRs are returned to accrual and
classified as performing after demonstrating a period of at
least six months of consecutive performance under the
restructured terms. Loans where borrowers have been
discharged from personal liability through Chapter 7
bankruptcy and have not formally reaffirmed their loan
obligations to PNC and loans to borrowers not currently
obligated to make both principal and interest payments under
the restructured terms are not returned to accrual status.
Additional Asset Quality Indicators
We have two overall portfolio segments – Commercial
Lending and Consumer Lending. Each of these two segments
is comprised of multiple loan classes. Classes are
characterized by similarities in initial measurement, risk
128 The PNC Financial Services Group, Inc. – Form 10-K