PNC Bank 2015 Annual Report Download - page 61
Download and view the complete annual report
Please find page 61 of the 2015 PNC Bank annual report below. You can navigate through the pages in the report by either clicking on the pages listed below, or by using the keyword search tool below to find specific information within the annual report.-
 1
1 -
2
-
3
-
4
-
5
-
6
-
7
-
8
-
9
-
10
-
11
-
12
-
13
-
14
-
15
-
16
-
17
-
18
-
19
-
20
-
21
-
22
-
23
-
24
-
25
-
26
-
27
-
28
-
29
-
30
-
31
-
32
-
33
-
34
-
35
-
36
-
37
-
38
-
39
-
40
-
41
-
42
-
43
-
44
-
45
-
46
-
47
-
48
-
49
-
50
-
 51
51 -
 52
52 -
 53
53 -
 54
54 -
 55
55 -
 56
56 -
 57
57 -
 58
58 -
 59
59 -
 60
60 -
 61
61 -
 62
62 -
 63
63 -
 64
64 -
 65
65 -
 66
66 -
 67
67 -
 68
68 -
 69
69 -
 70
70 -
 71
71 -
72
-
73
-
74
-
75
-
76
-
77
-
78
-
79
-
80
-
81
-
82
-
83
-
84
-
85
-
86
-
87
-
88
-
89
-
90
-
91
-
92
-
93
-
94
-
95
-
96
-
97
-
98
-
99
-
100
-
101
-
102
-
103
-
104
-
105
-
106
-
107
-
108
-
109
-
110
-
111
-
112
-
113
-
114
-
115
-
116
-
117
-
118
-
119
-
120
-
121
-
122
-
123
-
124
-
125
-
126
-
127
-
128
-
129
-
130
-
131
-
132
-
133
-
134
-
135
-
136
-
137
-
138
-
139
-
140
-
141
-
142
-
143
-
144
-
145
-
146
-
147
-
148
-
149
-
150
-
151
-
152
-
153
-
154
-
155
-
156
-
157
-
158
-
159
-
160
-
161
-
162
-
163
-
164
-
165
-
166
-
167
-
168
-
169
-
170
-
171
-
172
-
173
-
174
-
175
-
176
-
177
-
178
-
179
-
180
-
181
-
182
-
183
-
184
-
185
-
186
-
187
-
188
-
189
-
190
-
191
-
192
-
193
-
194
-
195
-
196
-
197
-
198
-
199
-
200
-
201
-
202
-
203
-
204
-
205
-
206
-
207
-
208
-
209
-
210
-
211
-
212
-
213
-
214
-
215
-
216
-
217
-
218
-
219
-
220
-
221
-
222
-
223
-
224
-
225
-
226
-
227
-
228
-
229
-
230
-
231
-
232
-
233
-
234
-
235
-
236
-
237
-
238
-
239
-
240
-
241
-
242
-
243
-
244
-
245
-
246
-
247
-
248
-
249
-
250
-
251
-
252
-
253
-
254
-
255
-
256
 |
 |
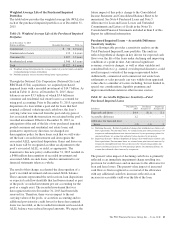
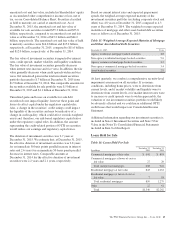
Weighted Average Life of the Purchased Impaired
Portfolios
The table below provides the weighted average life (WAL) for
each of the purchased impaired portfolios as of December 31,
2015.
Table 11: Weighted Average Life of the Purchased Impaired
Portfolios
As of December 31, 2015
Dollars in millions Recorded Investment WAL (a)
Commercial $ 36 2.0 years
Commercial real estate 133 1.6 years
Consumer (b) 1,407 3.9 years
Residential real estate 1,946 4.5 years
Total $3,522 4.1 years
(a) Weighted average life represents the average number of years for which each dollar
of unpaid principal remains outstanding.
(b) Portfolio primarily consists of nonrevolving home equity products.
Through the National City Corporation (National City) and
RBC Bank (USA) acquisitions, we acquired purchased
impaired loans with a recorded investment of $14.7 billion. As
noted in Table 11 above, at December 31, 2015, those
balances are now $3.5 billion, of which $3.4 billion in
consumer and residential real estate loans is accounted for
using pool accounting. Prior to December 31, 2015, upon final
disposition of a loan within a pool and for loans that had
nominal collateral value/expected cash flows, the loan’s
carrying value was removed from the pool and any gain or
loss associated with the transaction was retained in the pool’s
recorded investment. Effective December 31, 2015, in
anticipation of the end of the life of our purchased impaired
pooled consumer and residential real estate loans, and
pursuant to supervisory direction, we changed our
derecognition policy for these loans such that we will write-
off the loan’s recorded investment and derecognize the
associated ALLL upon final disposition. Gains and losses on
such loans will be recognized as either an adjustment to the
pool’s associated ALLL, or yield, as appropriate. The
transition to this new policy on December 31, 2015 resulted in
a $468 million derecognition of recorded investment and
associated ALLL on such loans, which is immaterial to our
financial statements taken as a whole.
The result of this change accelerated the derecognition of a
pool’s recorded investment and associated ALLL balance.
These amounts represented the net loss from loan dispositions
or expected cash flow shortfalls that had been retained as part
of the pools’ recorded investment per our accounting for the
pool as a single asset. The recorded investment that was
derecognized effective December 31, 2015 had been fully
reserved for. Therefore, there was no impact to the net
carrying values of the pools, or accretion accounting and no
additional provision for credit losses for these derecognized
loans was recorded, as the recorded investment and associated
ALLL balance were reduced in equal amounts. We expect the
future impact of this policy change to the Consolidated
Income Statement and Consolidated Balance Sheet to be
immaterial. See Note 4 Purchased Loans and Note 5
Allowance for Loan and Lease Losses and Unfunded
Commitments and Letters of Credit in the Notes To
Consolidated Financial Statements included in Item 8 of this
Report for additional information.
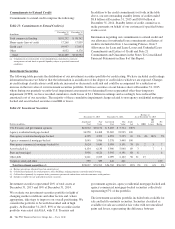
Purchased Impaired Loans – Accretable Difference
Sensitivity Analysis
The following table provides a sensitivity analysis on the
Total Purchased Impaired Loans portfolio. The analysis
reflects hypothetical changes in key drivers for expected cash
flows over the life of the loans under declining and improving
conditions at a point in time. Any unusual significant
economic events or changes, as well as other variables not
considered below (e.g., natural or widespread disasters), could
result in impacts outside of the ranges represented below.
Additionally, commercial and commercial real estate loan
settlements or sales proceeds can vary widely from appraised
values due to a number of factors including, but not limited to,
special use considerations, liquidity premiums and
improvements/deterioration in other income sources.
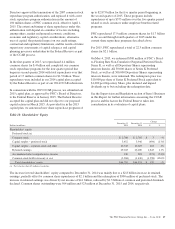
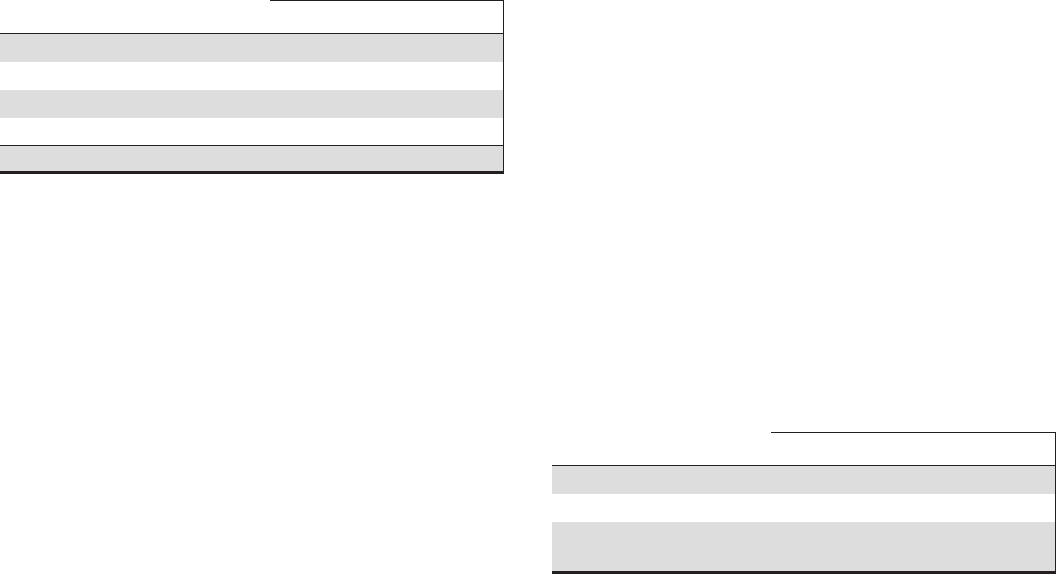
Table 12: Accretable Difference Sensitivity—Total
Purchased Impaired Loans
In billions
December 31,
2015
Declining
Scenario (a)
Improving
Scenario (b)
Expected cash flows $4.4 $(.1) $.1
Accretable difference 1.2 – –
Allowance for loan and lease
losses (.3) (.1) .1
(a) Declining Scenario – Reflects hypothetical changes that would decrease future cash
flow expectations. For consumer loans, we assume home price forecast decreases by
ten percent and unemployment rate forecast increases by two percentage points; for
commercial loans, we assume that collateral values decrease by ten percent.
(b) Improving Scenario – Reflects hypothetical changes that would increase future cash
flow expectations. For consumer loans, we assume home price forecast increases by
ten percent, unemployment rate forecast decreases by two percentage points and
interest rate forecast increases by two percentage points; for commercial loans, we
assume that collateral values increase by ten percent.
The present value impact of declining cash flows is primarily
reflected as an immediate impairment charge resulting in a
provision for credit losses and an increase to the allowance for
loan and lease losses. The present value impact of increased
cash flows is first recognized as a reversal of the allowance
with any additional cash flow increases reflected as an
increase in accretable yield over the life of the loan.
The PNC Financial Services Group, Inc. – Form 10-K 43