PNC Bank 2015 Annual Report Download - page 143
Download and view the complete annual report
Please find page 143 of the 2015 PNC Bank annual report below. You can navigate through the pages in the report by either clicking on the pages listed below, or by using the keyword search tool below to find specific information within the annual report.-
 1
1 -
2
-
3
-
4
-
5
-
6
-
7
-
8
-
9
-
10
-
11
-
12
-
13
-
14
-
15
-
16
-
17
-
18
-
19
-
20
-
21
-
22
-
23
-
24
-
25
-
26
-
27
-
28
-
29
-
30
-
31
-
32
-
33
-
34
-
35
-
36
-
37
-
38
-
39
-
40
-
41
-
42
-
43
-
44
-
45
-
46
-
47
-
48
-
49
-
50
-
51
-
52
-
53
-
54
-
55
-
56
-
57
-
58
-
59
-
60
-
61
-
62
-
63
-
64
-
65
-
66
-
67
-
68
-
69
-
70
-
71
-
72
-
73
-
74
-
75
-
76
-
77
-
78
-
79
-
80
-
81
-
82
-
83
-
84
-
85
-
86
-
87
-
88
-
89
-
90
-
91
-
92
-
93
-
94
-
95
-
96
-
97
-
98
-
99
-
100
-
101
-
102
-
103
-
104
-
105
-
106
-
107
-
108
-
109
-
110
-
111
-
112
-
113
-
114
-
115
-
116
-
117
-
118
-
119
-
120
-
121
-
122
-
123
-
124
-
125
-
126
-
127
-
128
-
129
-
130
-
131
-
132
-
 133
133 -
 134
134 -
 135
135 -
 136
136 -
 137
137 -
 138
138 -
 139
139 -
 140
140 -
 141
141 -
 142
142 -
 143
143 -
 144
144 -
 145
145 -
 146
146 -
 147
147 -
 148
148 -
 149
149 -
 150
150 -
 151
151 -
 152
152 -
 153
153 -
154
-
155
-
156
-
157
-
158
-
159
-
160
-
161
-
162
-
163
-
164
-
165
-
166
-
167
-
168
-
169
-
170
-
171
-
172
-
173
-
174
-
175
-
176
-
177
-
178
-
179
-
180
-
181
-
182
-
183
-
184
-
185
-
186
-
187
-
188
-
189
-
190
-
191
-
192
-
193
-
194
-
195
-
196
-
197
-
198
-
199
-
200
-
201
-
202
-
203
-
204
-
205
-
206
-
207
-
208
-
209
-
210
-
211
-
212
-
213
-
214
-
215
-
216
-
217
-
218
-
219
-
220
-
221
-
222
-
223
-
224
-
225
-
226
-
227
-
228
-
229
-
230
-
231
-
232
-
233
-
234
-
235
-
236
-
237
-
238
-
239
-
240
-
241
-
242
-
243
-
244
-
245
-
246
-
247
-
248
-
249
-
250
-
251
-
252
-
253
-
254
-
255
-
256
 |
 |

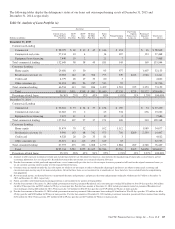
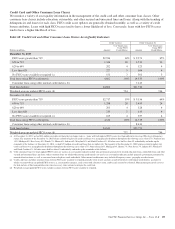
Table 53: Non-Consolidated VIEs
In millions
PNC Risk
of Loss (a)
Carrying Value of
Assets Owned by PNC
Carrying Value of
Liabilities Owned by PNC
December 31, 2015
Commercial Mortgage-Backed Securitizations (b) $ 1,498 $ 1,498 (c) $ 1 (e)
Residential Mortgage-Backed Securitizations (b) 6,680 6,680 (c) 1 (e)
Tax Credit Investments and Other 2,551 2,622 (d) 836 (f)
Total $10,729 $10,800 $838
December 31, 2014
Commercial Mortgage-Backed Securitizations (b) $ 1,550 $ 1,550 (c) $ 1 (e)
Residential Mortgage-Backed Securitizations (b) 3,385 3,385 (c) 4 (e)
Tax Credit Investments and Other 2,270 2,304 (d) 777 (f)
Total $ 7,205 $ 7,239 $782
(a) This represents loans, investments and other assets related to non-consolidated VIEs, net of collateral (if applicable).
(b) Amounts reflect involvement with securitization SPEs where PNC transferred to and/or services loans for an SPE and we hold securities issued by that SPE. Values disclosed in the
PNC Risk of Loss column represent our maximum exposure to loss for those securities’ holdings.
(c) Included in Trading securities, Investment securities, Other intangible assets and Other assets on our Consolidated Balance Sheet.
(d) Included in Loans, Equity investments and Other assets on our Consolidated Balance Sheet.
(e) Included in Other liabilities on our Consolidated Balance Sheet.
(f) Included in Deposits and Other liabilities on our Consolidated Balance Sheet.
Residential and Commercial Mortgage-Backed
Securitizations
In connection with each Agency and Non-agency
securitization discussed above, we evaluate each SPE utilized
in these transactions for consolidation. In performing these
assessments, we evaluate our level of continuing involvement
in these transactions as the nature of our involvement
ultimately determines whether or not we hold a variable
interest and/or are the primary beneficiary of the SPE. Factors
we consider in our consolidation assessment include the
significance of (i) our role as servicer, (ii) our holdings of
mortgage-backed securities issued by the securitization SPE,
and (iii) the rights of third-party variable interest holders.
The first step in our assessment is to determine whether we hold
a variable interest in the securitization SPE. We hold variable
interests in Agency and Non-agency securitization SPEs
through our holding of mortgage-backed securities issued by the
SPEs and/or our recourse obligations. Each SPE in which we
hold a variable interest is evaluated to determine whether we are
the primary beneficiary of the entity. For Agency securitization
transactions, our contractual role as servicer does not give us the
power to direct the activities that most significantly affect the
economic performance of the SPEs. Thus, we are not the
primary beneficiary of these entities. For Non-agency
securitization transactions, we would be the primary beneficiary
to the extent our servicing activities give us the power to direct
the activities that most significantly affect the economic
performance of the SPE and we hold a more than insignificant
variable interest in the entity.
Details about the Agency and Non-agency securitization SPEs
where we hold a variable interest and are not the primary
beneficiary are included in Table 53. Our maximum exposure
to loss as a result of our involvement with these SPEs is the
carrying value of the mortgage-backed securities, servicing
assets, servicing advances, and our liabilities associated with
our recourse obligations. Creditors of the securitization SPEs
have no recourse to PNC’s assets or general credit.
Tax Credit Investments and Other
For tax credit investments in which we do not have the right to
make decisions that will most significantly impact the
economic performance of the entity, we are not the primary
beneficiary and thus they are not consolidated. These
investments are disclosed in Table 53. The table also reflects
our maximum exposure to loss exclusive of any potential tax
credit recapture. Our maximum exposure to loss is equal to
our legally binding equity commitments adjusted for recorded
impairment, partnership results, or amortization for qualifying
low income housing tax credit investments when applicable.
For all legally binding unfunded equity commitments, we
increase our recognized investment and recognize a liability.
As of December 31, 2015, we had a liability for unfunded
commitments of $.5 billion related to investments in qualified
affordable housing projects which is reflected in Other
liabilities on our Consolidated Balance Sheet.
Table 53 also includes our involvement in lease financing
transactions with LLCs engaged in solar power generation that
to a large extent provided returns in the form of tax credits.
The outstanding financings and operating lease assets are
reflected as Loans and Other assets, respectively, on our
Consolidated Balance Sheet, whereas related liabilities are
reported in Deposits and Other liabilities.
The PNC Financial Services Group, Inc. – Form 10-K 125