PNC Bank 2015 Annual Report Download - page 150
Download and view the complete annual report
Please find page 150 of the 2015 PNC Bank annual report below. You can navigate through the pages in the report by either clicking on the pages listed below, or by using the keyword search tool below to find specific information within the annual report.-
 1
1 -
2
-
3
-
4
-
5
-
6
-
7
-
8
-
9
-
10
-
11
-
12
-
13
-
14
-
15
-
16
-
17
-
18
-
19
-
20
-
21
-
22
-
23
-
24
-
25
-
26
-
27
-
28
-
29
-
30
-
31
-
32
-
33
-
34
-
35
-
36
-
37
-
38
-
39
-
40
-
41
-
42
-
43
-
44
-
45
-
46
-
47
-
48
-
49
-
50
-
51
-
52
-
53
-
54
-
55
-
56
-
57
-
58
-
59
-
60
-
61
-
62
-
63
-
64
-
65
-
66
-
67
-
68
-
69
-
70
-
71
-
72
-
73
-
74
-
75
-
76
-
77
-
78
-
79
-
80
-
81
-
82
-
83
-
84
-
85
-
86
-
87
-
88
-
89
-
90
-
91
-
92
-
93
-
94
-
95
-
96
-
97
-
98
-
99
-
100
-
101
-
102
-
103
-
104
-
105
-
106
-
107
-
108
-
109
-
110
-
111
-
112
-
113
-
114
-
115
-
116
-
117
-
118
-
119
-
120
-
121
-
122
-
123
-
124
-
125
-
126
-
127
-
128
-
129
-
130
-
131
-
132
-
133
-
134
-
135
-
136
-
137
-
138
-
139
-
 140
140 -
 141
141 -
 142
142 -
 143
143 -
 144
144 -
 145
145 -
 146
146 -
 147
147 -
 148
148 -
 149
149 -
 150
150 -
 151
151 -
 152
152 -
 153
153 -
 154
154 -
 155
155 -
 156
156 -
 157
157 -
 158
158 -
 159
159 -
 160
160 -
161
-
162
-
163
-
164
-
165
-
166
-
167
-
168
-
169
-
170
-
171
-
172
-
173
-
174
-
175
-
176
-
177
-
178
-
179
-
180
-
181
-
182
-
183
-
184
-
185
-
186
-
187
-
188
-
189
-
190
-
191
-
192
-
193
-
194
-
195
-
196
-
197
-
198
-
199
-
200
-
201
-
202
-
203
-
204
-
205
-
206
-
207
-
208
-
209
-
210
-
211
-
212
-
213
-
214
-
215
-
216
-
217
-
218
-
219
-
220
-
221
-
222
-
223
-
224
-
225
-
226
-
227
-
228
-
229
-
230
-
231
-
232
-
233
-
234
-
235
-
236
-
237
-
238
-
239
-
240
-
241
-
242
-
243
-
244
-
245
-
246
-
247
-
248
-
249
-
250
-
251
-
252
-
253
-
254
-
255
-
256
 |
 |

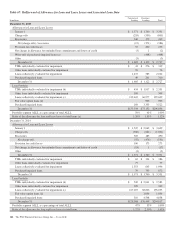
(continued from previous page)
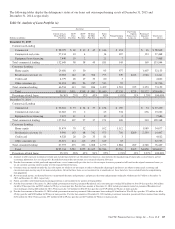
Home Equity Residential Real Estate
December 31, 2014 – in millions 1st Liens 2nd Liens Total
Current estimated LTV ratios (c)
Greater than or equal to 125% and updated FICO scores:
Greater than 660 $ 333 $ 1,399 $ 360 $ 2,092
Less than or equal to 660 (d) (e) 57 273 92 422
Missing FICO 1 9 8 18
Greater than or equal to 100% to less than 125% and updated FICO scores:
Greater than 660 839 2,190 772 3,801
Less than or equal to 660 (d) (e) 118 383 153 654
Missing FICO 1 5 12 18
Greater than or equal to 90% to less than 100% and updated FICO scores:
Greater than 660 891 1,703 755 3,349
Less than or equal to 660 103 271 118 492
Missing FICO 2 3 5 10
Less than 90% and updated FICO scores:
Greater than 660 13,878 7,874 7,703 29,455
Less than or equal to 660 1,319 995 573 2,887
Missing FICO 27 14 109 150
Total home equity and residential real estate loans $17,569 $15,119 $10,660 $43,348
(a) Excludes purchased impaired loans of approximately $3.4 billion and $4.5 billion in recorded investment, certain government insured or guaranteed residential real estate mortgages of
approximately $0.9 billion and $1.2 billion, and loans held for sale at December 31, 2015 and December 31, 2014, respectively. See the Home Equity and Residential Real Estate
Asset Quality Indicators – Purchased Impaired Loans table below for additional information on purchased impaired loans.
(b) Amounts shown represent recorded investment.
(c) Based upon updated LTV (inclusive of combined loan-to-value (CLTV) for first and subordinate lien positions). Updated LTV is estimated using modeled property values. These
ratios are updated at least semi-annually. The related estimates and inputs are based upon an approach that uses a combination of third-party automated valuation models (AVMs),
broker price opinions (BPOs), HPI indices, property location, internal and external balance information, origination data and management assumptions. We generally utilize
origination lien balances provided by a third-party, where applicable, which do not include an amortization assumption when calculating updated LTV. Accordingly, the results of
these calculations do not represent actual appraised loan level collateral or updated LTV based upon lien balances held by others, and as such, are necessarily imprecise and subject to
change as we enhance our methodology.
(d) Higher risk loans are defined as loans with both an updated FICO score of less than or equal to 660 and an updated LTV greater than or equal to 100%.
(e) The following states had the highest percentage of higher risk loans at December 31, 2015: New Jersey 14%, Pennsylvania 12%, Illinois 11%, Ohio 11%, Florida 7%, Maryland 7%
and Michigan 5%. The remainder of the states had lower than 4% of the higher risk loans individually, and collectively they represent approximately 33% of the higher risk loans. The
following states had the highest percentage of higher risk loans at December 31, 2014: New Jersey 14%, Pennsylvania 12%, Illinois 12%, Ohio 12%, Florida 8%, Maryland 6%,
Michigan 5%, and North Carolina 4%. The remainder of the states had lower than 4% of the high risk loans individually, and collectively they represent approximately 28% of the
higher risk loans.
132 The PNC Financial Services Group, Inc. – Form 10-K