PNC Bank 2015 Annual Report Download - page 227
Download and view the complete annual report
Please find page 227 of the 2015 PNC Bank annual report below. You can navigate through the pages in the report by either clicking on the pages listed below, or by using the keyword search tool below to find specific information within the annual report.-
 1
1 -
2
-
3
-
4
-
5
-
6
-
7
-
8
-
9
-
10
-
11
-
12
-
13
-
14
-
15
-
16
-
17
-
18
-
19
-
20
-
21
-
22
-
23
-
24
-
25
-
26
-
27
-
28
-
29
-
30
-
31
-
32
-
33
-
34
-
35
-
36
-
37
-
38
-
39
-
40
-
41
-
42
-
43
-
44
-
45
-
46
-
47
-
48
-
49
-
50
-
51
-
52
-
53
-
54
-
55
-
56
-
57
-
58
-
59
-
60
-
61
-
62
-
63
-
64
-
65
-
66
-
67
-
68
-
69
-
70
-
71
-
72
-
73
-
74
-
75
-
76
-
77
-
78
-
79
-
80
-
81
-
82
-
83
-
84
-
85
-
86
-
87
-
88
-
89
-
90
-
91
-
92
-
93
-
94
-
95
-
96
-
97
-
98
-
99
-
100
-
101
-
102
-
103
-
104
-
105
-
106
-
107
-
108
-
109
-
110
-
111
-
112
-
113
-
114
-
115
-
116
-
117
-
118
-
119
-
120
-
121
-
122
-
123
-
124
-
125
-
126
-
127
-
128
-
129
-
130
-
131
-
132
-
133
-
134
-
135
-
136
-
137
-
138
-
139
-
140
-
141
-
142
-
143
-
144
-
145
-
146
-
147
-
148
-
149
-
150
-
151
-
152
-
153
-
154
-
155
-
156
-
157
-
158
-
159
-
160
-
161
-
162
-
163
-
164
-
165
-
166
-
167
-
168
-
169
-
170
-
171
-
172
-
173
-
174
-
175
-
176
-
177
-
178
-
179
-
180
-
181
-
182
-
183
-
184
-
185
-
186
-
187
-
188
-
189
-
190
-
191
-
192
-
193
-
194
-
195
-
196
-
197
-
198
-
199
-
200
-
201
-
202
-
203
-
204
-
205
-
206
-
207
-
208
-
209
-
210
-
211
-
212
-
213
-
214
-
215
-
216
-
 217
217 -
 218
218 -
 219
219 -
 220
220 -
 221
221 -
 222
222 -
 223
223 -
 224
224 -
 225
225 -
 226
226 -
 227
227 -
 228
228 -
 229
229 -
 230
230 -
 231
231 -
 232
232 -
 233
233 -
 234
234 -
 235
235 -
 236
236 -
 237
237 -
238
-
239
-
240
-
241
-
242
-
243
-
244
-
245
-
246
-
247
-
248
-
249
-
250
-
251
-
252
-
253
-
254
-
255
-
256
 |
 |

N
OTE
22 P
ARENT
C
OMPANY
Summarized financial information of the parent company is as
follows:
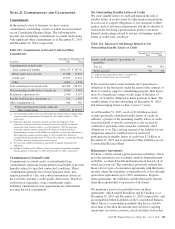
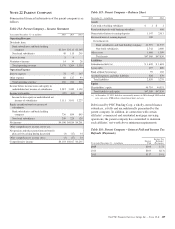
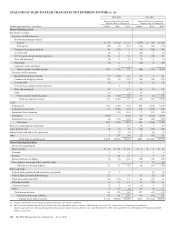
Table 134: Parent Company – Income Statement
Year ended December 31 – in millions 2015 2014 2013
Operating Revenue
Dividends from:
Bank subsidiaries and bank holding
company $3,110 $3,115 $3,105
Non-bank subsidiaries 49 115 205
Interest income 5 4
Noninterest income 14 30 28
Total operating revenue 3,178 3,264 3,338
Operating Expense
Interest expense 78 97 107
Other expense 88 127 93
Total operating expense 166 224 200
Income before income taxes and equity in
undistributed net income of subsidiaries 3,012 3,040 3,138
Income tax benefits (99) (61) (89)
Income before equity in undistributed net
income of subsidiaries 3,111 3,101 3,227
Equity in undistributed net income of
subsidiaries:
Bank subsidiaries and bank holding
company 736 854 845
Non-bank subsidiaries 259 229 129
Net income $4,106 $4,184 $4,201
Other comprehensive income, net of tax:
Net pension and other postretirement benefit
plan activity arising during the period (3) (17) 34
Other comprehensive income (loss) (3) (17) 34
Comprehensive income $4,103 $4,167 $4,235
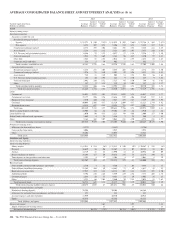
Table 135: Parent Company – Balance Sheet
December 31 – in millions 2015 2014
Assets
Cash held at banking subsidiary $ 1 $ 1
Restricted deposits with banking subsidiary 400
Nonrestricted interest-earning deposits 1,147 2,013
Restricted interest-earning deposits 300
Investments in:
Bank subsidiaries and bank holding company 41,919 41,537
Non-bank subsidiaries 2,742 2,480
Other assets 1,460 1,399
Total assets $47,569 $47,830
Liabilities
Subordinated debt (a) $ 1,639 $ 1,618
Senior debt 497 889
Bank affiliate borrowings 95 102
Accrued expenses and other liabilities 628 670
Total liabilities 2,859 3,279
Equity
Shareholders’ equity 44,710 44,551
Total liabilities and equity $47,569 $47,830
(a) At December 31, 2015, debt that contractually matures in 2016 through 2020 totaled
zero, zero, zero, $700 million (subordinated debt) and zero.
Debt issued by PNC Funding Corp, a wholly-owned finance
subsidiary, is fully and unconditionally guaranteed by the
parent company. In addition, in connection with certain
affiliates’ commercial and residential mortgage servicing
operations, the parent company has committed to maintain
such affiliates’ net worth above minimum requirements.
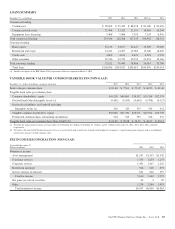
Table 136: Parent Company – Interest Paid and Income Tax
Refunds (Payments)
Year ended December 31 – in millions
Interest
Paid
Income Tax
Refunds /
(Payments)
2015 $106 $ 72
2014 $103 $(13)
2013 $117 $ 91
The PNC Financial Services Group, Inc. – Form 10-K 209