PNC Bank 2015 Annual Report Download - page 73
Download and view the complete annual report
Please find page 73 of the 2015 PNC Bank annual report below. You can navigate through the pages in the report by either clicking on the pages listed below, or by using the keyword search tool below to find specific information within the annual report.-
 1
1 -
2
-
3
-
4
-
5
-
6
-
7
-
8
-
9
-
10
-
11
-
12
-
13
-
14
-
15
-
16
-
17
-
18
-
19
-
20
-
21
-
22
-
23
-
24
-
25
-
26
-
27
-
28
-
29
-
30
-
31
-
32
-
33
-
34
-
35
-
36
-
37
-
38
-
39
-
40
-
41
-
42
-
43
-
44
-
45
-
46
-
47
-
48
-
49
-
50
-
51
-
52
-
53
-
54
-
55
-
56
-
57
-
58
-
59
-
60
-
61
-
62
-
 63
63 -
 64
64 -
 65
65 -
 66
66 -
 67
67 -
 68
68 -
 69
69 -
 70
70 -
 71
71 -
 72
72 -
 73
73 -
 74
74 -
 75
75 -
 76
76 -
 77
77 -
 78
78 -
 79
79 -
 80
80 -
 81
81 -
 82
82 -
 83
83 -
84
-
85
-
86
-
87
-
88
-
89
-
90
-
91
-
92
-
93
-
94
-
95
-
96
-
97
-
98
-
99
-
100
-
101
-
102
-
103
-
104
-
105
-
106
-
107
-
108
-
109
-
110
-
111
-
112
-
113
-
114
-
115
-
116
-
117
-
118
-
119
-
120
-
121
-
122
-
123
-
124
-
125
-
126
-
127
-
128
-
129
-
130
-
131
-
132
-
133
-
134
-
135
-
136
-
137
-
138
-
139
-
140
-
141
-
142
-
143
-
144
-
145
-
146
-
147
-
148
-
149
-
150
-
151
-
152
-
153
-
154
-
155
-
156
-
157
-
158
-
159
-
160
-
161
-
162
-
163
-
164
-
165
-
166
-
167
-
168
-
169
-
170
-
171
-
172
-
173
-
174
-
175
-
176
-
177
-
178
-
179
-
180
-
181
-
182
-
183
-
184
-
185
-
186
-
187
-
188
-
189
-
190
-
191
-
192
-
193
-
194
-
195
-
196
-
197
-
198
-
199
-
200
-
201
-
202
-
203
-
204
-
205
-
206
-
207
-
208
-
209
-
210
-
211
-
212
-
213
-
214
-
215
-
216
-
217
-
218
-
219
-
220
-
221
-
222
-
223
-
224
-
225
-
226
-
227
-
228
-
229
-
230
-
231
-
232
-
233
-
234
-
235
-
236
-
237
-
238
-
239
-
240
-
241
-
242
-
243
-
244
-
245
-
246
-
247
-
248
-
249
-
250
-
251
-
252
-
253
-
254
-
255
-
256
 |
 |

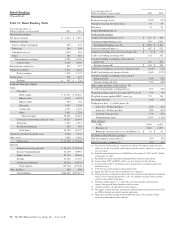
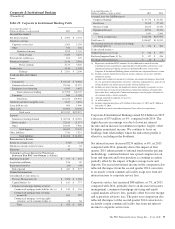
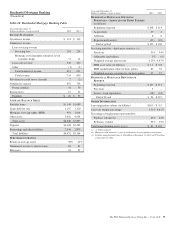
Corporate & Institutional Banking
(Unaudited)
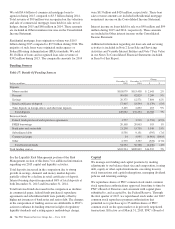
Table 22: Corporate & Institutional Banking Table
Year ended December 31
Dollars in millions, except as noted 2015 2014
I
NCOME
S
TATEMENT
Net interest income $ 3,494 $ 3,733
Noninterest income
Corporate service fees 1,383 1,295
Other 552 448
Noninterest income 1,935 1,743
Total revenue 5,429 5,476
Provision for credit losses 106 107
Noninterest expense 2,148 2,064
Pretax earnings 3,175 3,305
Income taxes 1,144 1,199
Earnings $ 2,031 $ 2,106
A
VERAGE
B
ALANCE
S
HEET
Loans
Commercial $ 85,416 $ 78,688
Commercial real estate 23,036 21,127
Equipment lease financing 6,940 6,892
Total commercial lending 115,392 106,707
Consumer 866 1,198
Total loans 116,258 107,905
Goodwill and other intangible assets 3,847 3,826
Loans held for sale 966 1,006
Other assets 10,961 10,190
Total assets $132,032 $122,927
Deposits
Noninterest-bearing demand $ 48,318 $ 44,210
Money market 22,185 21,377
Other 10,189 7,958
Total deposits 80,692 73,545
Other liabilities 7,746 7,551
Total liabilities $ 88,438 $ 81,096
P
ERFORMANCE
R
ATIOS
Return on average assets 1.54% 1.71%
Noninterest income to total revenue 36 32
Efficiency 40 38
C
OMMERCIAL
L
OAN
S
ERVICING
P
ORTFOLIO
–
S
ERVICED
F
OR
PNC
AND
O
THERS
(in billions)
Beginning of period $ 377 $ 347
Acquisitions/additions 156 99
Repayments/transfers (86) (69)
End of period $ 447 $ 377
O
THER
I
NFORMATION
Consolidated revenue from: (a)
Treasury Management (b) $ 1,388 $ 1,288
Capital Markets (b) $ 813 $ 777
Commercial mortgage banking activities
Commercial mortgage loans held for sale (c) $ 140 $ 126
Commercial mortgage loan servicing
income (d) 261 222
Commercial mortgage servicing rights
valuation, net of economic hedge (e) 28 38
Total $ 429 $ 386
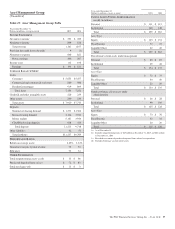
Year ended December 31
Dollars in millions, except as noted 2015 2014
Average Loans (by C&IB business)
Corporate Banking $ 57,774 $ 54,341
Real Estate 31,312 27,740
Business Credit 14,615 13,270
Equipment Finance 10,954 10,474
Other 1,603 2,080
Total average loans $116,258 $107,905
Total loans (f) $118,607 $113,935
Net carrying amount of commercial mortgage
servicing rights (f) $ 526 $ 506
Credit-related statistics:
Nonperforming assets (f) (g) $ 518 $ 557
Purchased impaired loans (f) (h) $ 137 $ 246
Net charge-offs (recoveries) $ 30 $ 8
(a) Represents consolidated PNC amounts. See the additional revenue discussion
regarding treasury management, capital markets-related products and services, and
commercial mortgage banking activities in the Product Revenue section of the
Corporate & Institutional Banking portion of this Business Segments Review section.
(b) Includes amounts reported in net interest income, corporate service fees and other
noninterest income.
(c) Includes other noninterest income for valuations on commercial mortgage loans held
for sale and related commitments, derivative valuations, origination fees, gains on sale
of loans held for sale and net interest income on loans held for sale.
(d) Includes net interest income and noninterest income (primarily in corporate services
fees) from loan servicing net of reduction in commercial mortgage servicing rights
due to time decay and payoffs. Commercial mortgage servicing rights valuation, net
of economic hedge is shown separately.
(e) Amounts reported in corporate services fees.
(f) As of December 31.
(g) Includes nonperforming loans of $.4 billion at December 31, 2015 and $.5 billion at
December 31, 2014.
(h) Recorded investment of purchased impaired loans related to acquisitions.
Corporate & Institutional Banking earned $2.0 billion in 2015,
a decrease of $75 million, or 4%, compared with 2014. The
slight decrease in earnings was due to lower net interest
income and an increase in noninterest expense, largely offset
by higher noninterest income. We continue to focus on
building client relationships where the risk-return profile is
attractive, including in the Southeast.
Net interest income decreased $239 million, or 6%, in 2015
compared with 2014, primarily due to the impact of first
quarter 2015 enhancements to internal funds transfer pricing
methodology, continued interest rate spread compression on
loans and deposits and lower purchase accounting accretion,
partially offset by the impact of higher average loans and
deposits. Decreased net interest income in the comparison also
reflected the impact from the second quarter 2014 correction
to reclassify certain commercial facility usage fees from net
interest income to corporate service fees.
Corporate service fees increased $88 million, or 7%, in 2015
compared with 2014, primarily due to an increase in treasury
management, commercial mortgage servicing and equity
capital markets advisory fees, partially offset by lower merger
and acquisition advisory fees. The prior year comparison also
reflected the impact of the second quarter 2014 correction to
reclassify certain commercial facility fees from net interest
income to corporate service fees.
The PNC Financial Services Group, Inc. – Form 10-K 55