PNC Bank 2015 Annual Report Download - page 55
Download and view the complete annual report
Please find page 55 of the 2015 PNC Bank annual report below. You can navigate through the pages in the report by either clicking on the pages listed below, or by using the keyword search tool below to find specific information within the annual report.-
 1
1 -
2
-
3
-
4
-
5
-
6
-
7
-
8
-
9
-
10
-
11
-
12
-
13
-
14
-
15
-
16
-
17
-
18
-
19
-
20
-
21
-
22
-
23
-
24
-
25
-
26
-
27
-
28
-
29
-
30
-
31
-
32
-
33
-
34
-
35
-
36
-
37
-
38
-
39
-
40
-
41
-
42
-
43
-
44
-
 45
45 -
 46
46 -
 47
47 -
 48
48 -
 49
49 -
 50
50 -
 51
51 -
 52
52 -
 53
53 -
 54
54 -
 55
55 -
 56
56 -
 57
57 -
 58
58 -
 59
59 -
 60
60 -
 61
61 -
 62
62 -
 63
63 -
 64
64 -
 65
65 -
66
-
67
-
68
-
69
-
70
-
71
-
72
-
73
-
74
-
75
-
76
-
77
-
78
-
79
-
80
-
81
-
82
-
83
-
84
-
85
-
86
-
87
-
88
-
89
-
90
-
91
-
92
-
93
-
94
-
95
-
96
-
97
-
98
-
99
-
100
-
101
-
102
-
103
-
104
-
105
-
106
-
107
-
108
-
109
-
110
-
111
-
112
-
113
-
114
-
115
-
116
-
117
-
118
-
119
-
120
-
121
-
122
-
123
-
124
-
125
-
126
-
127
-
128
-
129
-
130
-
131
-
132
-
133
-
134
-
135
-
136
-
137
-
138
-
139
-
140
-
141
-
142
-
143
-
144
-
145
-
146
-
147
-
148
-
149
-
150
-
151
-
152
-
153
-
154
-
155
-
156
-
157
-
158
-
159
-
160
-
161
-
162
-
163
-
164
-
165
-
166
-
167
-
168
-
169
-
170
-
171
-
172
-
173
-
174
-
175
-
176
-
177
-
178
-
179
-
180
-
181
-
182
-
183
-
184
-
185
-
186
-
187
-
188
-
189
-
190
-
191
-
192
-
193
-
194
-
195
-
196
-
197
-
198
-
199
-
200
-
201
-
202
-
203
-
204
-
205
-
206
-
207
-
208
-
209
-
210
-
211
-
212
-
213
-
214
-
215
-
216
-
217
-
218
-
219
-
220
-
221
-
222
-
223
-
224
-
225
-
226
-
227
-
228
-
229
-
230
-
231
-
232
-
233
-
234
-
235
-
236
-
237
-
238
-
239
-
240
-
241
-
242
-
243
-
244
-
245
-
246
-
247
-
248
-
249
-
250
-
251
-
252
-
253
-
254
-
255
-
256
 |
 |

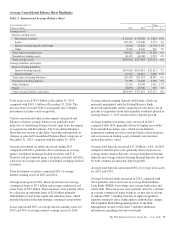
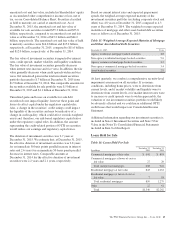
Average Consolidated Balance Sheet Highlights
Table 2: Summarized Average Balance Sheet
Year ended December 31 Change
Dollars in millions 2015 2014 $ %
Average assets
Interest-earning assets
Investment securities $ 61,665 $ 55,820 $ 5,845 10%
Loans 205,349 199,648 5,701 3%
Interest-earning deposits with banks 32,908 19,204 13,704 71%
Other 8,903 8,633 270 3%
Total interest-earning assets 308,825 283,305 25,520 9%
Noninterest-earning assets 46,139 44,548 1,591 4%
Total average assets $354,964 $327,853 $27,111 8%
Average liabilities and equity
Interest-bearing liabilities
Interest-bearing deposits $163,965 $152,814 $11,151 7%
Borrowed funds 56,513 48,817 7,696 16%
Total interest-bearing liabilities 220,478 201,631 18,847 9%
Noninterest-bearing deposits 76,398 70,108 6,290 9%
Other liabilities 12,210 10,768 1,442 13%
Equity 45,878 45,346 532 1%
Total average liabilities and equity $354,964 $327,853 $27,111 8%
Total assets were $358.5 billion at December 31, 2015
compared with $345.1 billion at December 31, 2014. The
increase from year end 2014 was primarily due to higher
investment securities and loan growth.
Various seasonal and other factors impact our period-end
balances, whereas average balances are generally more
indicative of underlying business trends apart from the impact
of acquisitions and divestitures. The Consolidated Balance
Sheet Review section of this Item 7 provides information on
changes in selected Consolidated Balance Sheet categories at
December 31, 2015 compared with December 31, 2014.
Average investment securities increased during 2015
compared with 2014, primarily due to increases in average
agency residential mortgage-backed securities and U.S.
Treasury and government agency securities, partially offset by
a decrease in average non-agency residential mortgage-backed
securities.
Total investment securities comprised 20% of average
interest-earning assets in 2015 and 2014.
Average loans grew in 2015, driven by increases in average
commercial loans of $5.7 billion and average commercial real
estate loans of $2.5 billion. These increases were partially offset
by a decrease in consumer loans of $2.4 billion primarily
attributable to lower home equity and education loans, which
included declines in the non-strategic consumer loan portfolio.
Loans represented 66% of average interest-earning assets for
2015 and 70% of average interest-earning assets for 2014.
Average interest-earning deposits with banks, which are
primarily maintained with the Federal Reserve Bank,
increased significantly in the comparison to the prior year in
part due to regulatory short-term liquidity standards phased in
starting January 1, 2015 and also due to deposit growth.
Average noninterest-earning assets increased in 2015
compared with 2014, primarily driven by higher receivables
from unsettled securities sales, which are included in
noninterest-earning assets for average balance sheet purposes,
and an increase in trading assets, primarily net customer-
related derivatives values.
Average total deposits increased $17.4 billion, or 8%, in 2015
compared with the prior year, primarily due to increases in
average money market deposits, average noninterest-bearing
deposits and average interest-bearing demand deposits driven
by both commercial and retail deposit growth.
Average total deposits represented 68% of average total assets
for 2015 and 2014.
Average borrowed funds increased in 2015 compared with
2014 primarily due to increases in average Federal Home
Loan Bank (FHLB) borrowings and average bank notes and
senior debt. These increases were partially offset by a decline
in average commercial paper balances, in part due to actions
to enhance PNC’s funding structure in light of regulatory
liquidity standards and a rating agency methodology change.
The Liquidity Risk Management portion of the Risk
Management section of this Item 7 includes additional
information regarding our borrowed funds.
The PNC Financial Services Group, Inc. – Form 10-K 37