PNC Bank 2015 Annual Report Download - page 64
Download and view the complete annual report
Please find page 64 of the 2015 PNC Bank annual report below. You can navigate through the pages in the report by either clicking on the pages listed below, or by using the keyword search tool below to find specific information within the annual report.-
 1
1 -
2
-
3
-
4
-
5
-
6
-
7
-
8
-
9
-
10
-
11
-
12
-
13
-
14
-
15
-
16
-
17
-
18
-
19
-
20
-
21
-
22
-
23
-
24
-
25
-
26
-
27
-
28
-
29
-
30
-
31
-
32
-
33
-
34
-
35
-
36
-
37
-
38
-
39
-
40
-
41
-
42
-
43
-
44
-
45
-
46
-
47
-
48
-
49
-
50
-
51
-
52
-
53
-
 54
54 -
 55
55 -
 56
56 -
 57
57 -
 58
58 -
 59
59 -
 60
60 -
 61
61 -
 62
62 -
 63
63 -
 64
64 -
 65
65 -
 66
66 -
 67
67 -
 68
68 -
 69
69 -
 70
70 -
 71
71 -
 72
72 -
 73
73 -
 74
74 -
75
-
76
-
77
-
78
-
79
-
80
-
81
-
82
-
83
-
84
-
85
-
86
-
87
-
88
-
89
-
90
-
91
-
92
-
93
-
94
-
95
-
96
-
97
-
98
-
99
-
100
-
101
-
102
-
103
-
104
-
105
-
106
-
107
-
108
-
109
-
110
-
111
-
112
-
113
-
114
-
115
-
116
-
117
-
118
-
119
-
120
-
121
-
122
-
123
-
124
-
125
-
126
-
127
-
128
-
129
-
130
-
131
-
132
-
133
-
134
-
135
-
136
-
137
-
138
-
139
-
140
-
141
-
142
-
143
-
144
-
145
-
146
-
147
-
148
-
149
-
150
-
151
-
152
-
153
-
154
-
155
-
156
-
157
-
158
-
159
-
160
-
161
-
162
-
163
-
164
-
165
-
166
-
167
-
168
-
169
-
170
-
171
-
172
-
173
-
174
-
175
-
176
-
177
-
178
-
179
-
180
-
181
-
182
-
183
-
184
-
185
-
186
-
187
-
188
-
189
-
190
-
191
-
192
-
193
-
194
-
195
-
196
-
197
-
198
-
199
-
200
-
201
-
202
-
203
-
204
-
205
-
206
-
207
-
208
-
209
-
210
-
211
-
212
-
213
-
214
-
215
-
216
-
217
-
218
-
219
-
220
-
221
-
222
-
223
-
224
-
225
-
226
-
227
-
228
-
229
-
230
-
231
-
232
-
233
-
234
-
235
-
236
-
237
-
238
-
239
-
240
-
241
-
242
-
243
-
244
-
245
-
246
-
247
-
248
-
249
-
250
-
251
-
252
-
253
-
254
-
255
-
256
 |
 |

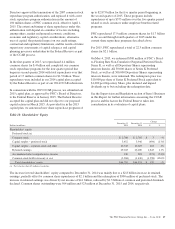
We sold $4.4 billion of commercial mortgage loans to
agencies during 2015 compared to $3.5 billion during 2014.
Total revenue of $99 million was recognized on the valuation
and sale of commercial mortgage loans held for sale, net of
hedges, during 2015 and $80 million in 2014. These amounts
are included in Other noninterest income on the Consolidated
Income Statement.
Residential mortgage loan origination volume was $10.5
billion during 2015 compared to $9.5 billion during 2014. The
majority of such loans were originated under agency or
Federal Housing Administration (FHA) standards. We sold
$8.1 billion of loans and recognized loan sales revenue of
$342 million during 2015. The comparable amounts for 2014
were $8.3 billion and $420 million, respectively. These loan
sales revenue amounts are included in Residential mortgage
noninterest income on the Consolidated Income Statement.
Interest income on loans held for sale was $90 million and $99
million during 2015 and 2014, respectively. These amounts
are included in Other interest income on the Consolidated
Income Statement.
Additional information regarding our loan sale and servicing
activities is included in Note 2 Loan Sale and Servicing
Activities and Variable Interest Entities and Note 7 Fair Value
in our Notes To Consolidated Financial Statements included
in Item 8 of this Report.
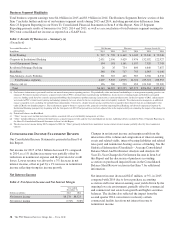
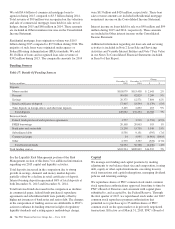
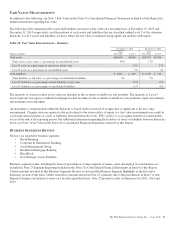
Funding Sources
Table 17: Details Of Funding Sources
Dollars in millions
December 31
2015
December 31
2014
Change
$%
Deposits
Money market $118,079 $115,438 $ 2,641 2%
Demand 90,038 82,829 7,209 9%
Savings 20,375 12,571 7,804 62%
Retail certificates of deposit 17,405 18,544 (1,139) (6)%
Time deposits in foreign offices and other time deposits 3,105 2,852 253 9%
Total deposits 249,002 232,234 16,768 7%
Borrowed funds
Federal funds purchased and repurchase agreements 1,777 3,510 (1,733) (49)%
FHLB borrowings 20,108 20,005 103 1%
Bank notes and senior debt 21,298 15,750 5,548 35%
Subordinated debt 8,556 9,151 (595) (7)%
Commercial paper 14 4,995 (4,981) (100)%
Other 2,779 3,357 (578) (17)%
Total borrowed funds 54,532 56,768 (2,236) (4)%
Total funding sources $303,534 $289,002 $14,532 5%
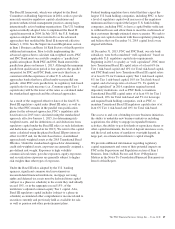
See the Liquidity Risk Management portion of the Risk
Management section of this Item 7 for additional information
regarding our 2015 capital and liquidity activities.
Total deposits increased in the comparison due to strong
growth in savings, demand, and money market deposits,
partially offset by a decline in retail certificates of deposit.
Interest-bearing deposits represented 68% of total deposits at
both December 31, 2015 and December 31, 2014.
Total borrowed funds decreased in the comparison as declines
in commercial paper, federal funds purchased, repurchase
agreements and subordinated debt were partially offset by
higher net issuances of bank notes and senior debt. The changes
in the composition of funding sources are attributable to PNC’s
actions to enhance its funding structure in light of regulatory
liquidity standards and a rating agency methodology change.
Capital
We manage our funding and capital positions by making
adjustments to our balance sheet size and composition, issuing
debt, equity or other capital instruments, executing treasury
stock transactions and capital redemptions, managing dividend
policies and retaining earnings.
We repurchase shares of PNC common stock under common
stock repurchase authorizations approved from time to time by
PNC’s Board of Directors and consistent with capital plans
submitted to, and accepted by, the Federal Reserve. Through
the first quarter of 2015, we repurchased stock under our 2007
common stock repurchase program authorization that
permitted us to purchase up to 25 million shares of PNC
common stock on the open market or in privately negotiated
transactions. Effective as of March 31, 2015, PNC’s Board of
46 The PNC Financial Services Group, Inc. – Form 10-K