PNC Bank 2015 Annual Report Download - page 184
Download and view the complete annual report
Please find page 184 of the 2015 PNC Bank annual report below. You can navigate through the pages in the report by either clicking on the pages listed below, or by using the keyword search tool below to find specific information within the annual report.-
 1
1 -
2
-
3
-
4
-
5
-
6
-
7
-
8
-
9
-
10
-
11
-
12
-
13
-
14
-
15
-
16
-
17
-
18
-
19
-
20
-
21
-
22
-
23
-
24
-
25
-
26
-
27
-
28
-
29
-
30
-
31
-
32
-
33
-
34
-
35
-
36
-
37
-
38
-
39
-
40
-
41
-
42
-
43
-
44
-
45
-
46
-
47
-
48
-
49
-
50
-
51
-
52
-
53
-
54
-
55
-
56
-
57
-
58
-
59
-
60
-
61
-
62
-
63
-
64
-
65
-
66
-
67
-
68
-
69
-
70
-
71
-
72
-
73
-
74
-
75
-
76
-
77
-
78
-
79
-
80
-
81
-
82
-
83
-
84
-
85
-
86
-
87
-
88
-
89
-
90
-
91
-
92
-
93
-
94
-
95
-
96
-
97
-
98
-
99
-
100
-
101
-
102
-
103
-
104
-
105
-
106
-
107
-
108
-
109
-
110
-
111
-
112
-
113
-
114
-
115
-
116
-
117
-
118
-
119
-
120
-
121
-
122
-
123
-
124
-
125
-
126
-
127
-
128
-
129
-
130
-
131
-
132
-
133
-
134
-
135
-
136
-
137
-
138
-
139
-
140
-
141
-
142
-
143
-
144
-
145
-
146
-
147
-
148
-
149
-
150
-
151
-
152
-
153
-
154
-
155
-
156
-
157
-
158
-
159
-
160
-
161
-
162
-
163
-
164
-
165
-
166
-
167
-
168
-
169
-
170
-
171
-
172
-
173
-
 174
174 -
 175
175 -
 176
176 -
 177
177 -
 178
178 -
 179
179 -
 180
180 -
 181
181 -
 182
182 -
 183
183 -
 184
184 -
 185
185 -
 186
186 -
 187
187 -
 188
188 -
 189
189 -
 190
190 -
 191
191 -
 192
192 -
 193
193 -
 194
194 -
195
-
196
-
197
-
198
-
199
-
200
-
201
-
202
-
203
-
204
-
205
-
206
-
207
-
208
-
209
-
210
-
211
-
212
-
213
-
214
-
215
-
216
-
217
-
218
-
219
-
220
-
221
-
222
-
223
-
224
-
225
-
226
-
227
-
228
-
229
-
230
-
231
-
232
-
233
-
234
-
235
-
236
-
237
-
238
-
239
-
240
-
241
-
242
-
243
-
244
-
245
-
246
-
247
-
248
-
249
-
250
-
251
-
252
-
253
-
254
-
255
-
256
 |
 |

N
OTE
8G
OODWILL AND
I
NTANGIBLE
A
SSETS
Assets and liabilities of acquired entities are recorded at
estimated fair value as of the acquisition date.
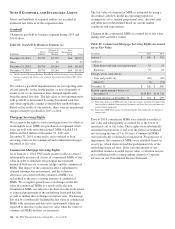
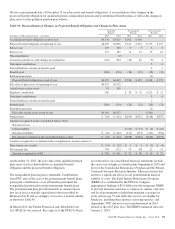
Goodwill
Changes in goodwill by business segment during 2015 and
2014 follow:
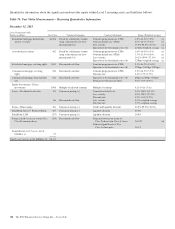
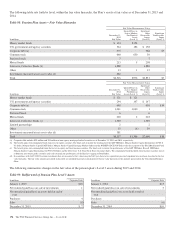
Table 82: Goodwill by Business Segment (a)
In millions
Retail
Banking
Corporate &
Institutional
Banking
Asset
Management
Group Total
December 31, 2013 $5,795 $3,215 $64 $9,074
Other 29 29
December 31, 2014 $5,795 $3,244 $64 $9,103
December 31, 2015 $5,795 $3,244 $64 $9,103
(a) The Residential Mortgage Banking, BlackRock and Non-Strategic Assets Portfolio
business segments did not have any goodwill allocated to them during 2015, 2014,
and 2013.
We conduct a goodwill impairment test on our reporting units
at least annually, in the fourth quarter, or more frequently if
events occur or circumstances have changed significantly
from the annual test date. The fair value of our reporting units
with goodwill is determined by using discounted cash flow
and, when applicable, market comparability methodologies.
Based on the results of our analysis, there were no impairment
charges related to goodwill in 2015 or 2014.
Mortgage Servicing Rights
We recognize the right to service mortgage loans for others as
an intangible asset. MSRs are purchased or originated when
loans are sold with servicing retained. MSRs totaled $1.6
billion and $1.4 billion at December 31, 2015 and
December 31, 2014, respectively, and consisted of loan
servicing contracts for commercial and residential mortgages
measured at fair value.
Commercial Mortgage Servicing Rights
As of January 1, 2014, PNC made an irrevocable election to
subsequently measure all classes of commercial MSRs at fair
value in order to eliminate any potential measurement
mismatch between our economic hedges and the commercial
MSRs. The impact of the cumulative-effect adjustment to
retained earnings was not material, and the valuation
allowance associated with the commercial MSRs was
reclassified to the gross carrying amount of commercial
MSRs. We recognize gains/(losses) on changes in the fair
value of commercial MSRs as a result of the election.
Commercial MSRs are subject to declines in value from actual
or expected prepayment of the underlying loans and defaults
as well as market driven changes in interest rates. We manage
this risk by economically hedging the fair value of commercial
MSRs with securities and derivative instruments which are
expected to increase (or decrease) in value when the value of
commercial MSRs declines (or increases).
The fair value of commercial MSRs is estimated by using a
discounted cash flow model incorporating inputs for
assumptions as to constant prepayment rates, discount rates
and other factors determined based on current market
conditions and expectations.
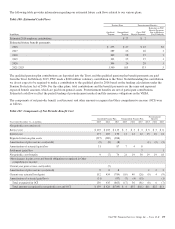
Changes in the commercial MSRs accounted for at fair value
during 2015 and 2014, follow:
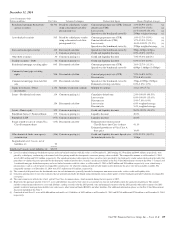
Table 83: Commercial Mortgage Servicing Rights Accounted
for at Fair Value
In millions 2015 2014
January 1 $ 506 $ 552
Additions:
From loans sold with servicing retained 63 53
Purchases 55 43
Changes in fair value due to:
Time and payoffs (a) (89) (89)
Other (b) (9) (53)
December 31 $ 526 $ 506
Related unpaid principal balance at
December 31 $145,823 $143,738
Servicing advances at December 31 $ 251 $ 299
(a) Represents decrease in MSR value due to passage of time, including the impact from
both regularly scheduled loan principal payments and loans that were paid down or
paid off during the period.
(b) Represents MSR value changes resulting primarily from market-driven changes in
interest rates.
Prior to 2014, commercial MSRs were initially recorded at
fair value and subsequently accounted for at the lower of
amortized cost or fair value. These rights were substantially
amortized in proportion to and over the period of estimated
net servicing income of 5 to 10 years. Commercial MSRs
were periodically evaluated for impairment. For purposes of
impairment, the commercial MSRs were stratified based on
asset type, which characterized the predominant risk of the
underlying financial asset. If the carrying amount of any
individual stratum exceeded its fair value, a valuation reserve
was established with a corresponding charge to Corporate
services on our Consolidated Income Statement.
166 The PNC Financial Services Group, Inc. – Form 10-K