PNC Bank 2015 Annual Report Download - page 167
Download and view the complete annual report
Please find page 167 of the 2015 PNC Bank annual report below. You can navigate through the pages in the report by either clicking on the pages listed below, or by using the keyword search tool below to find specific information within the annual report.-
 1
1 -
2
-
3
-
4
-
5
-
6
-
7
-
8
-
9
-
10
-
11
-
12
-
13
-
14
-
15
-
16
-
17
-
18
-
19
-
20
-
21
-
22
-
23
-
24
-
25
-
26
-
27
-
28
-
29
-
30
-
31
-
32
-
33
-
34
-
35
-
36
-
37
-
38
-
39
-
40
-
41
-
42
-
43
-
44
-
45
-
46
-
47
-
48
-
49
-
50
-
51
-
52
-
53
-
54
-
55
-
56
-
57
-
58
-
59
-
60
-
61
-
62
-
63
-
64
-
65
-
66
-
67
-
68
-
69
-
70
-
71
-
72
-
73
-
74
-
75
-
76
-
77
-
78
-
79
-
80
-
81
-
82
-
83
-
84
-
85
-
86
-
87
-
88
-
89
-
90
-
91
-
92
-
93
-
94
-
95
-
96
-
97
-
98
-
99
-
100
-
101
-
102
-
103
-
104
-
105
-
106
-
107
-
108
-
109
-
110
-
111
-
112
-
113
-
114
-
115
-
116
-
117
-
118
-
119
-
120
-
121
-
122
-
123
-
124
-
125
-
126
-
127
-
128
-
129
-
130
-
131
-
132
-
133
-
134
-
135
-
136
-
137
-
138
-
139
-
140
-
141
-
142
-
143
-
144
-
145
-
146
-
147
-
148
-
149
-
150
-
151
-
152
-
153
-
154
-
155
-
156
-
 157
157 -
 158
158 -
 159
159 -
 160
160 -
 161
161 -
 162
162 -
 163
163 -
 164
164 -
 165
165 -
 166
166 -
 167
167 -
 168
168 -
 169
169 -
 170
170 -
 171
171 -
 172
172 -
 173
173 -
 174
174 -
 175
175 -
 176
176 -
 177
177 -
178
-
179
-
180
-
181
-
182
-
183
-
184
-
185
-
186
-
187
-
188
-
189
-
190
-
191
-
192
-
193
-
194
-
195
-
196
-
197
-
198
-
199
-
200
-
201
-
202
-
203
-
204
-
205
-
206
-
207
-
208
-
209
-
210
-
211
-
212
-
213
-
214
-
215
-
216
-
217
-
218
-
219
-
220
-
221
-
222
-
223
-
224
-
225
-
226
-
227
-
228
-
229
-
230
-
231
-
232
-
233
-
234
-
235
-
236
-
237
-
238
-
239
-
240
-
241
-
242
-
243
-
244
-
245
-
246
-
247
-
248
-
249
-
250
-
251
-
252
-
253
-
254
-
255
-
256
 |
 |

N
OTE
7F
AIR
V
ALUE
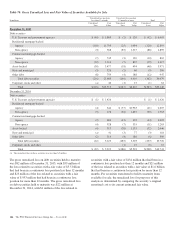
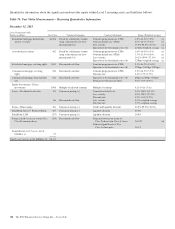
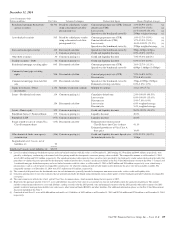
Fair Value Measurement
PNC measures certain financial assets and liabilities at fair
value in accordance with GAAP. Fair value is defined in
GAAP as the price that would be received to sell an asset or
the price that would be paid to transfer a liability on the
measurement date. GAAP focuses on the exit price in the
principal or most advantageous market for the asset or liability
in an orderly transaction between market participants. GAAP
also establishes a fair value hierarchy to maximize the use of
observable inputs when measuring fair value and defines the
three levels of inputs as noted below.
Level 1
Fair value is determined using a quoted price in an active
market for identical assets or liabilities. Level 1 assets and
liabilities may include debt securities, equity securities and
listed derivative contracts that are traded in an active exchange
market and certain U.S. Treasury securities that are actively
traded in over-the-counter markets.
Level 2
Fair value is estimated using inputs other than quoted prices
included within Level 1 that are observable for assets or
liabilities, either directly or indirectly. The majority of Level 2
assets and liabilities include debt securities, equity securities
and listed derivative contracts with quoted prices that are
traded in markets that are not active, and certain debt and
equity securities and over-the-counter derivative contracts
whose fair value is determined using a pricing model without
significant unobservable inputs.
Level 3
Fair value is estimated using unobservable inputs that are
significant to the fair value of the assets or liabilities. Level 3
assets and liabilities include financial instruments whose value
is determined using pricing models and discounted cash flow
methodologies, or similar techniques for which the significant
valuation inputs are not observable and the determination of
fair value requires significant management judgment or
estimation.
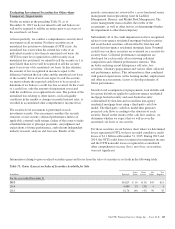
Certain assets which have been adjusted due to impairment are
accounted for at lower of amortized cost or fair value on a
nonrecurring basis and consist primarily of certain nonaccrual
loans, OREO and foreclosed assets and long-lived assets held
for sale. These assets, which are generally classified as
Level 3, are included in Table 77 in this Note 7.
We characterize active markets as those where transaction
volumes are sufficient to provide objective pricing
information, with reasonably narrow bid/ask spreads and
where dealer quotes received do not vary widely and are based
on current information. Inactive markets are typically
characterized by low transaction volumes, price quotations
that vary substantially among market participants or are not
based on current information, wide bid/ask spreads, a
significant increase in implied liquidity risk premiums, yields,
or performance indicators for observed transactions or quoted
prices compared to historical periods, a significant decline or
absence of a market for new issuance, or any combination of
the above factors. We also consider nonperformance risks
including credit risk as part of our valuation methodology for
all assets and liabilities measured at fair value.
Any models used to determine fair values or to validate dealer
quotes based on the descriptions below are subject to review
and independent testing as part of our model validation and
internal control testing processes. Our Model Risk
Management Committee reviews significant models on at
least an annual basis. In addition, the Valuation Committee
approves valuation methodologies and reviews the results of
independent valuation reviews and processes for assets and
liabilities measured at fair value on a recurring basis.
Assets and liabilities measured at fair value, by their nature,
result in a higher degree of financial statement volatility.
Assets and liabilities classified within Level 3 inherently
require the use of various assumptions, estimates and
judgments when measuring their fair value. As observable
market activity is commonly not available to use when
estimating the fair value of Level 3 assets and liabilities, we
must estimate fair value using various modeling techniques.
These techniques include the use of a variety of inputs/
assumptions including credit quality, liquidity, interest rates or
other relevant inputs across the entire population of our
Level 3 assets and liabilities. Changes in the significant
underlying factors or assumptions (either an increase or a
decrease) in any of these areas underlying our estimates may
result in a significant increase/decrease in the Level 3 fair
value measurement of a particular asset and/or liability from
period to period.
The PNC Financial Services Group, Inc. – Form 10-K 149