PNC Bank 2015 Annual Report Download - page 76
Download and view the complete annual report
Please find page 76 of the 2015 PNC Bank annual report below. You can navigate through the pages in the report by either clicking on the pages listed below, or by using the keyword search tool below to find specific information within the annual report.-
 1
1 -
2
-
3
-
4
-
5
-
6
-
7
-
8
-
9
-
10
-
11
-
12
-
13
-
14
-
15
-
16
-
17
-
18
-
19
-
20
-
21
-
22
-
23
-
24
-
25
-
26
-
27
-
28
-
29
-
30
-
31
-
32
-
33
-
34
-
35
-
36
-
37
-
38
-
39
-
40
-
41
-
42
-
43
-
44
-
45
-
46
-
47
-
48
-
49
-
50
-
51
-
52
-
53
-
54
-
55
-
56
-
57
-
58
-
59
-
60
-
61
-
62
-
63
-
64
-
65
-
 66
66 -
 67
67 -
 68
68 -
 69
69 -
 70
70 -
 71
71 -
 72
72 -
 73
73 -
 74
74 -
 75
75 -
 76
76 -
 77
77 -
 78
78 -
 79
79 -
 80
80 -
 81
81 -
 82
82 -
 83
83 -
 84
84 -
 85
85 -
 86
86 -
87
-
88
-
89
-
90
-
91
-
92
-
93
-
94
-
95
-
96
-
97
-
98
-
99
-
100
-
101
-
102
-
103
-
104
-
105
-
106
-
107
-
108
-
109
-
110
-
111
-
112
-
113
-
114
-
115
-
116
-
117
-
118
-
119
-
120
-
121
-
122
-
123
-
124
-
125
-
126
-
127
-
128
-
129
-
130
-
131
-
132
-
133
-
134
-
135
-
136
-
137
-
138
-
139
-
140
-
141
-
142
-
143
-
144
-
145
-
146
-
147
-
148
-
149
-
150
-
151
-
152
-
153
-
154
-
155
-
156
-
157
-
158
-
159
-
160
-
161
-
162
-
163
-
164
-
165
-
166
-
167
-
168
-
169
-
170
-
171
-
172
-
173
-
174
-
175
-
176
-
177
-
178
-
179
-
180
-
181
-
182
-
183
-
184
-
185
-
186
-
187
-
188
-
189
-
190
-
191
-
192
-
193
-
194
-
195
-
196
-
197
-
198
-
199
-
200
-
201
-
202
-
203
-
204
-
205
-
206
-
207
-
208
-
209
-
210
-
211
-
212
-
213
-
214
-
215
-
216
-
217
-
218
-
219
-
220
-
221
-
222
-
223
-
224
-
225
-
226
-
227
-
228
-
229
-
230
-
231
-
232
-
233
-
234
-
235
-
236
-
237
-
238
-
239
-
240
-
241
-
242
-
243
-
244
-
245
-
246
-
247
-
248
-
249
-
250
-
251
-
252
-
253
-
254
-
255
-
256
 |
 |
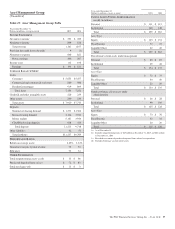
Asset Management Group earned $194 million in 2015
compared to $181 million in 2014, an increase of $13 million,
or 7%. Earnings increased due to increases in net interest
income and noninterest income, partially offset by an increase
in noninterest expense.
Total revenue for 2015 increased $54 million compared to
2014. Noninterest income increased $51 million, or 6%,
primarily relating to the impact from a $30 million trust
settlement in the second quarter of 2015, new sales production
and stronger average equity markets. Net interest income
increased $3 million, or 1%, in 2015 compared to 2014,
primarily due to an increase in average loan and deposit
balances, partially offset by continued spread compression.
Noninterest expense increased by $25 million, or 3%, in 2015
compared to the prior year, primarily attributable to higher
compensation expense and investments in technology. Asset
Management Group remains focused on disciplined expense
management as it invests in strategic growth opportunities.
The core growth strategies of the business include increasing
sales sourced from other PNC lines of business, maximizing
front line productivity and optimizing market presence in high
opportunity markets. Wealth Management and Hawthorn have
over 100 offices operating in 7 out of the 10 most affluent
states in the U.S. with a majority co-located with retail
banking branches. The businesses’ strategies primarily focus
on growing client assets under management through
expanding relationships directly and through cross-selling
from PNC’s other lines of business.
Institutional Asset Management provides advisory, custody,
and retirement administration services to institutional clients
primarily within our banking footprint. The business also
offers PNC proprietary mutual funds and investment
strategies. Institutional Asset Management is strengthening its
partnership with Corporate and Institutional Banking and
other internal channels to drive growth and is focused on
building retirement capabilities and expanding product
solutions for all customers.
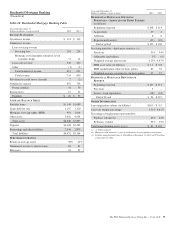
Assets under administration were $259 billion as of
December 31, 2015 compared to $263 billion as of
December 31, 2014, largely due to a decline in
nondiscretionary client assets under administration.
Discretionary client assets under management decreased $1
billion at December 31, 2015 compared to December 31,
2014, driven by lower equity markets on a spot basis, partially
offset by positive net flows, after adjustments for cyclical
client activities.
Average loan balances increased $.2 billion, or 3%, in 2015
compared to the prior year due to continued growth in the
consumer loan portfolio. Asset Management Group’s clients’
preference for liquidity in the form of a new line of credit
product has driven significant growth in the loan portfolio.
The line of credit product is primarily secured by the market
value of the client’s underlying investment management
account assets. Average deposits for 2015 increased $1.5
billion, or 15%, compared to the prior year, driven by an
increase in money market products.
58 The PNC Financial Services Group, Inc. – Form 10-K