PNC Bank 2015 Annual Report Download - page 232
Download and view the complete annual report
Please find page 232 of the 2015 PNC Bank annual report below. You can navigate through the pages in the report by either clicking on the pages listed below, or by using the keyword search tool below to find specific information within the annual report.-
 1
1 -
2
-
3
-
4
-
5
-
6
-
7
-
8
-
9
-
10
-
11
-
12
-
13
-
14
-
15
-
16
-
17
-
18
-
19
-
20
-
21
-
22
-
23
-
24
-
25
-
26
-
27
-
28
-
29
-
30
-
31
-
32
-
33
-
34
-
35
-
36
-
37
-
38
-
39
-
40
-
41
-
42
-
43
-
44
-
45
-
46
-
47
-
48
-
49
-
50
-
51
-
52
-
53
-
54
-
55
-
56
-
57
-
58
-
59
-
60
-
61
-
62
-
63
-
64
-
65
-
66
-
67
-
68
-
69
-
70
-
71
-
72
-
73
-
74
-
75
-
76
-
77
-
78
-
79
-
80
-
81
-
82
-
83
-
84
-
85
-
86
-
87
-
88
-
89
-
90
-
91
-
92
-
93
-
94
-
95
-
96
-
97
-
98
-
99
-
100
-
101
-
102
-
103
-
104
-
105
-
106
-
107
-
108
-
109
-
110
-
111
-
112
-
113
-
114
-
115
-
116
-
117
-
118
-
119
-
120
-
121
-
122
-
123
-
124
-
125
-
126
-
127
-
128
-
129
-
130
-
131
-
132
-
133
-
134
-
135
-
136
-
137
-
138
-
139
-
140
-
141
-
142
-
143
-
144
-
145
-
146
-
147
-
148
-
149
-
150
-
151
-
152
-
153
-
154
-
155
-
156
-
157
-
158
-
159
-
160
-
161
-
162
-
163
-
164
-
165
-
166
-
167
-
168
-
169
-
170
-
171
-
172
-
173
-
174
-
175
-
176
-
177
-
178
-
179
-
180
-
181
-
182
-
183
-
184
-
185
-
186
-
187
-
188
-
189
-
190
-
191
-
192
-
193
-
194
-
195
-
196
-
197
-
198
-
199
-
200
-
201
-
202
-
203
-
204
-
205
-
206
-
207
-
208
-
209
-
210
-
211
-
212
-
213
-
214
-
215
-
216
-
217
-
218
-
219
-
220
-
221
-
 222
222 -
 223
223 -
 224
224 -
 225
225 -
 226
226 -
 227
227 -
 228
228 -
 229
229 -
 230
230 -
 231
231 -
 232
232 -
 233
233 -
 234
234 -
 235
235 -
 236
236 -
 237
237 -
 238
238 -
 239
239 -
 240
240 -
 241
241 -
 242
242 -
243
-
244
-
245
-
246
-
247
-
248
-
249
-
250
-
251
-
252
-
253
-
254
-
255
-
256
 |
 |

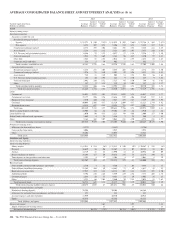
AVERAGE CONSOLIDATED BALANCE SHEET AND NET INTEREST ANALYSIS (a) (b) (c)
2015 2014 2013
Taxable-equivalent basis
Dollars in millions
Average
Balances
Interest
Income/
Expense
Average
Yields/
Rates
Average
Balances
Interest
Income/
Expense
Average
Yields/
Rates
Average
Balances
Interest
Income/
Expense
Average
Yields/
Rates
Assets
Interest-earning assets:
Investment securities
Securities available for sale
Residential mortgage-backed
Agency $ 21,371 $ 540 2.53% $ 18,935 $ 503 2.66% $ 22,746 $ 562 2.47%
Non-agency 4,374 207 4.73 5,106 244 4.78 5,828 317 5.44
Commercial mortgage-backed 6,372 195 3.06 5,461 192 3.52 5,228 222 4.25
Asset-backed 5,234 111 2.12 5,321 105 1.97 5,857 110 1.88
U.S. Treasury and government agencies 6,486 79 1.22 4,837 57 1.18 2,326 37 1.59
State and municipal 1,982 93 4.69 2,148 96 4.47 2,250 97 4.31
Other debt 1,844 52 2.82 2,016 52 2.58 2,632 64 2.43
Corporate stocks and other 518 1 .19 402 – – 342 – –
Total securities available for sale 48,181 1,278 2.65 44,226 1,249 2.82 47,209 1,409 2.98
Securities held to maturity
Residential mortgage-backed 8,238 251 3.05 5,885 207 3.52 4,374 153 3.50
Commercial mortgage-backed 1,976 75 3.80 2,502 99 3.96 3,422 151 4.41
Asset-backed 738 11 1.49 908 14 1.54 983 16 1.63
U.S. Treasury and government agencies 253 10 3.95 243 9 3.70 235 9 3.83
State and municipal 1,992 110 5.52 1,727 95 5.50 749 42 5.61
Other 287 9 3.14 329 10 3.04 347 11 3.17
Total securities held to maturity 13,484 466 3.46 11,594 434 3.74 10,110 382 3.78
Total investment securities 61,665 1,744 2.83 55,820 1,683 3.02 57,319 1,791 3.12
Loans
Commercial 98,093 2,975 3.03 92,411 3,029 3.28 86,047 3,243 3.77
Commercial real estate 25,177 896 3.56 22,646 919 4.06 19,469 937 4.81
Equipment lease financing 7,570 260 3.43 7,567 278 3.67 7,329 292 3.98
Consumer 60,094 2,505 4.17 62,529 2,609 4.17 62,125 2,744 4.42
Residential real estate 14,415 697 4.84 14,495 721 4.97 15,003 773 5.15
Total loans 205,349 7,333 3.57 199,648 7,556 3.78 189,973 7,989 4.21
Interest-earning deposits with banks 32,908 86 .26 19,204 49 .26 4,910 12 .24
Loans held for sale 2,070 90 4.35 2,123 99 4.66 2,909 157 5.40
Federal funds sold and resale agreements 1,669 4 .24 1,446 5 .35 960 8 .83
Other 5,164 262 5.07 5,064 228 4.50 4,574 218 4.77
Total interest-earning assets/interest income 308,825 9,519 3.08 283,305 9,620 3.40 260,645 10,175 3.90
Noninterest-earning assets:
Allowance for loan and lease losses (3,273) (3,482) (3,796)
Cash and due from banks 4,006 3,945 3,953
Other 45,406 44,085 44,862
Total assets $354,964 $327,853 $305,664
Liabilities and Equity
Interest-bearing liabilities:
Interest-bearing deposits
Money market $ 81,911 $ 214 .26% $ 75,513 $ 140 .19% $ 70,567 $ 128 .18%
Demand 46,649 26 .06 43,367 22 .05 40,144 18 .04
Savings 14,719 32 .22 11,990 14 .12 10,954 10 .09
Retail certificates of deposit 18,294 127 .69 19,636 145 .74 22,274 180 .81
Time deposits in foreign offices and other time 2,392 4 .17 2,308 4 .17 2,061 8 .39
Total interest-bearing deposits 163,965 403 .25 152,814 325 .21 146,000 344 .24
Borrowed funds
Federal funds purchased and repurchase agreements 2,510 3 .12 3,560 3 .08 3,884 6 .15
Federal Home Loan Bank borrowings 21,365 104 .49 14,863 73 .49 8,617 45 .52
Bank notes and senior debt 17,937 223 1.24 14,114 202 1.43 11,221 191 1.70
Subordinated debt 8,796 236 2.68 8,559 219 2.56 7,373 205 2.78
Commercial paper 2,684 10 .37 4,861 14 .29 6,902 16 .23
Other 3,221 66 2.05 2,860 70 2.45 2,025 53 2.62
Total borrowed funds 56,513 642 1.14 48,817 581 1.19 40,022 516 1.29
Total interest-bearing liabilities/interest expense 220,478 1,045 .47 201,631 906 .45 186,022 860 .46
Noninterest-bearing liabilities and equity:
Noninterest-bearing deposits 76,398 70,108 66,168
Allowance for unfunded loan commitments and letters of credit 251 238 241
Accrued expenses and other liabilities 11,959 10,530 10,918
Equity 45,878 45,346 42,315
Total liabilities and equity $354,964 $327,853 $305,664
Interest rate spread 2.61 2.95 3.44
Impact of noninterest-bearing sources .13 .13 .13
Net interest income/margin $8,474 2.74% $8,714 3.08% $ 9,315 3.57%
214 The PNC Financial Services Group, Inc. – Form 10-K