PNC Bank 2015 Annual Report Download - page 168
Download and view the complete annual report
Please find page 168 of the 2015 PNC Bank annual report below. You can navigate through the pages in the report by either clicking on the pages listed below, or by using the keyword search tool below to find specific information within the annual report.-
 1
1 -
2
-
3
-
4
-
5
-
6
-
7
-
8
-
9
-
10
-
11
-
12
-
13
-
14
-
15
-
16
-
17
-
18
-
19
-
20
-
21
-
22
-
23
-
24
-
25
-
26
-
27
-
28
-
29
-
30
-
31
-
32
-
33
-
34
-
35
-
36
-
37
-
38
-
39
-
40
-
41
-
42
-
43
-
44
-
45
-
46
-
47
-
48
-
49
-
50
-
51
-
52
-
53
-
54
-
55
-
56
-
57
-
58
-
59
-
60
-
61
-
62
-
63
-
64
-
65
-
66
-
67
-
68
-
69
-
70
-
71
-
72
-
73
-
74
-
75
-
76
-
77
-
78
-
79
-
80
-
81
-
82
-
83
-
84
-
85
-
86
-
87
-
88
-
89
-
90
-
91
-
92
-
93
-
94
-
95
-
96
-
97
-
98
-
99
-
100
-
101
-
102
-
103
-
104
-
105
-
106
-
107
-
108
-
109
-
110
-
111
-
112
-
113
-
114
-
115
-
116
-
117
-
118
-
119
-
120
-
121
-
122
-
123
-
124
-
125
-
126
-
127
-
128
-
129
-
130
-
131
-
132
-
133
-
134
-
135
-
136
-
137
-
138
-
139
-
140
-
141
-
142
-
143
-
144
-
145
-
146
-
147
-
148
-
149
-
150
-
151
-
152
-
153
-
154
-
155
-
156
-
157
-
 158
158 -
 159
159 -
 160
160 -
 161
161 -
 162
162 -
 163
163 -
 164
164 -
 165
165 -
 166
166 -
 167
167 -
 168
168 -
 169
169 -
 170
170 -
 171
171 -
 172
172 -
 173
173 -
 174
174 -
 175
175 -
 176
176 -
 177
177 -
 178
178 -
179
-
180
-
181
-
182
-
183
-
184
-
185
-
186
-
187
-
188
-
189
-
190
-
191
-
192
-
193
-
194
-
195
-
196
-
197
-
198
-
199
-
200
-
201
-
202
-
203
-
204
-
205
-
206
-
207
-
208
-
209
-
210
-
211
-
212
-
213
-
214
-
215
-
216
-
217
-
218
-
219
-
220
-
221
-
222
-
223
-
224
-
225
-
226
-
227
-
228
-
229
-
230
-
231
-
232
-
233
-
234
-
235
-
236
-
237
-
238
-
239
-
240
-
241
-
242
-
243
-
244
-
245
-
246
-
247
-
248
-
249
-
250
-
251
-
252
-
253
-
254
-
255
-
256
 |
 |

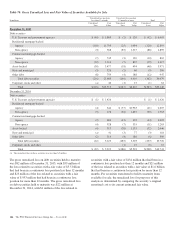
Assets and Liabilities Measured at Fair Value on a
Recurring Basis
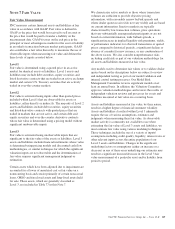
Securities Available for Sale and Trading Securities
Securities accounted for at fair value include both the
available for sale and trading portfolios. We primarily use
prices obtained from pricing services, dealer quotes, or recent
trades to determine the fair value of securities. As of
December 31, 2015, 87% of the positions in these portfolios
were priced by using pricing services provided by third-party
vendors. The third-party vendors use a variety of methods
when pricing securities that incorporate relevant market data
to arrive at an estimate of what a buyer in the marketplace
would pay for a security under current market conditions. One
of the vendor’s prices are set with reference to market activity
for highly liquid assets, such as U.S. Treasury and agency
securities and agency residential mortgage-backed securities,
and matrix pricing for other asset classes, such as commercial
mortgage-backed and other asset-backed securities. Another
vendor primarily uses discounted cash flow pricing models
considering adjustments for spreads and prepayments for the
instruments we value using this service, such as non-agency
residential mortgage-backed securities, agency adjustable rate
mortgage securities, agency collateralized mortgage
obligations (CMOs), commercial mortgage-backed securities
and municipal bonds. The vendors we use provide pricing
services on a global basis and have quality management
processes in place to monitor the integrity of the valuation
inputs and the prices provided to users, including procedures
to consider and incorporate information received from pricing
service users who may challenge a price. We monitor and
validate the reliability of vendor pricing on an ongoing basis
through pricing methodology reviews, by performing detailed
reviews of the assumptions and inputs used by the vendor to
price individual securities, and through price validation
testing. Price validation testing is performed independent of
the risk-taking function and involves corroborating the prices
received from third-party vendors with prices from another
third-party source, by reviewing valuations of comparable
instruments, by comparison to internal valuations, or by
reference to recent sales of similar securities. Securities not
priced by one of our pricing vendors may be valued using a
dealer quote. Dealer quotes received are typically non-
binding. Securities priced using a dealer quote are subject to
corroboration either with another dealer quote, by comparison
to similar securities priced by either a third-party vendor or
another dealer, or through internal valuation in order to
validate that the quote is representative of the market. Security
prices are also validated through actual cash settlement upon
sale of a security.
Securities are classified within the fair value hierarchy after
giving consideration to the activity level in the market for the
security type and the observability of the inputs used to
determine the fair value. When a quoted price in an active
market exists for the identical security, this price is used to
determine fair value and the security is classified within Level 1
of the hierarchy. Level 1 securities include certain U.S.
Treasury securities and exchange-traded equities. When a
quoted price in an active market for the identical security is not
available, fair value is estimated using either an alternative
market approach, such as a recent trade or matrix pricing, or an
income approach, such as a discounted cash flow pricing model.
If the inputs to the valuation are based primarily on market
observable information, then the security is classified within
Level 2 of the hierarchy. Level 2 securities include agency debt
securities, agency residential mortgage-backed securities,
agency and non-agency commercial mortgage-backed
securities, certain non-agency residential mortgage-backed
securities, asset-backed securities collateralized by non-
mortgage-related consumer loans, municipal securities, and
other debt securities. Level 2 securities are predominantly
priced by third parties, either a pricing vendor or dealer.
In certain cases where there is limited activity or less
transparency around the inputs to the valuation, securities are
classified within Level 3 of the hierarchy. Securities classified
as Level 3 consist primarily of non-agency residential
mortgage-backed and asset-backed securities collateralized by
first- and second-lien residential mortgage loans. Fair value for
these securities is primarily estimated using pricing obtained
from third-party vendors. In some cases, fair value is estimated
using a dealer quote, by reference to prices of securities of a
similar vintage and collateral type or by reference to recent
sales of similar securities. Market activity for these security
types is limited with little price transparency. As a result, these
securities are generally valued by the third-party vendor using a
discounted cash flow approach that incorporates observable
market activity where available. Significant inputs to the
valuation include prepayment projections and credit loss
assumptions (default rate and loss severity) and discount rates
that are deemed representative of current market conditions.
The discount rates used incorporate a spread over the
benchmark curve that takes into consideration liquidity risk and
potential credit risk not already included in the credit loss
assumptions. Significant increases (decreases) in any of those
assumptions in isolation would result in a significantly lower
(higher) fair value measurement. Prepayment estimates
generally increase when market interest rates decline and
decrease when market interest rates rise. Credit loss estimates
are driven by the ability of borrowers to pay their loans and
housing market prices and are impacted by changes in overall
macroeconomic conditions, typically increasing when economic
conditions worsen and decreasing when conditions improve. An
increase in the estimated prepayment rate typically results in a
decrease in estimated credit losses and vice versa. Discount
rates typically increase when market interest rates increase and/
or credit and liquidity risks increase. Similarly, discount rates
typically decrease when market interest rates decline and/or
credit and liquidity conditions improve. Price validation
procedures performed for these securities include comparing
current prices to historical pricing trends by collateral type and
vintage, and by obtaining corroborating prices from another
third-party source.
150 The PNC Financial Services Group, Inc. – Form 10-K