PNC Bank 2015 Annual Report Download - page 123
Download and view the complete annual report
Please find page 123 of the 2015 PNC Bank annual report below. You can navigate through the pages in the report by either clicking on the pages listed below, or by using the keyword search tool below to find specific information within the annual report.-
 1
1 -
2
-
3
-
4
-
5
-
6
-
7
-
8
-
9
-
10
-
11
-
12
-
13
-
14
-
15
-
16
-
17
-
18
-
19
-
20
-
21
-
22
-
23
-
24
-
25
-
26
-
27
-
28
-
29
-
30
-
31
-
32
-
33
-
34
-
35
-
36
-
37
-
38
-
39
-
40
-
41
-
42
-
43
-
44
-
45
-
46
-
47
-
48
-
49
-
50
-
51
-
52
-
53
-
54
-
55
-
56
-
57
-
58
-
59
-
60
-
61
-
62
-
63
-
64
-
65
-
66
-
67
-
68
-
69
-
70
-
71
-
72
-
73
-
74
-
75
-
76
-
77
-
78
-
79
-
80
-
81
-
82
-
83
-
84
-
85
-
86
-
87
-
88
-
89
-
90
-
91
-
92
-
93
-
94
-
95
-
96
-
97
-
98
-
99
-
100
-
101
-
102
-
103
-
104
-
105
-
106
-
107
-
108
-
109
-
110
-
111
-
112
-
 113
113 -
 114
114 -
 115
115 -
 116
116 -
 117
117 -
 118
118 -
 119
119 -
 120
120 -
 121
121 -
 122
122 -
 123
123 -
 124
124 -
 125
125 -
 126
126 -
 127
127 -
 128
128 -
 129
129 -
 130
130 -
 131
131 -
 132
132 -
 133
133 -
134
-
135
-
136
-
137
-
138
-
139
-
140
-
141
-
142
-
143
-
144
-
145
-
146
-
147
-
148
-
149
-
150
-
151
-
152
-
153
-
154
-
155
-
156
-
157
-
158
-
159
-
160
-
161
-
162
-
163
-
164
-
165
-
166
-
167
-
168
-
169
-
170
-
171
-
172
-
173
-
174
-
175
-
176
-
177
-
178
-
179
-
180
-
181
-
182
-
183
-
184
-
185
-
186
-
187
-
188
-
189
-
190
-
191
-
192
-
193
-
194
-
195
-
196
-
197
-
198
-
199
-
200
-
201
-
202
-
203
-
204
-
205
-
206
-
207
-
208
-
209
-
210
-
211
-
212
-
213
-
214
-
215
-
216
-
217
-
218
-
219
-
220
-
221
-
222
-
223
-
224
-
225
-
226
-
227
-
228
-
229
-
230
-
231
-
232
-
233
-
234
-
235
-
236
-
237
-
238
-
239
-
240
-
241
-
242
-
243
-
244
-
245
-
246
-
247
-
248
-
249
-
250
-
251
-
252
-
253
-
254
-
255
-
256
 |
 |

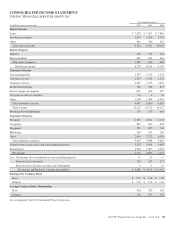
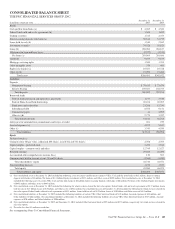
CONSOLIDATED BALANCE SHEET
THE PNC FINANCIAL SERVICES GROUP, INC.
In millions, except par value
December 31
2015
December 31
2014
Assets
Cash and due from banks (a) $ 4,065 $ 4,360
Federal funds sold and resale agreements (b) 1,369 1,852
Trading securities 1,726 2,353
Interest-earning deposits with banks (a) 30,546 31,779
Loans held for sale (b) 1,540 2,262
Investment securities 70,528 55,823
Loans (b) 206,696 204,817
Allowance for loan and lease losses (2,727) (3,331)
Net loans (a) 203,969 201,486
Goodwill 9,103 9,103
Mortgage servicing rights 1,589 1,351
Other intangible assets 379 493
Equity investments (a) 10,587 10,728
Other (a) (b) 23,092 23,482
Total assets $358,493 $345,072
Liabilities
Deposits
Noninterest-bearing $ 79,435 $ 73,479
Interest-bearing 169,567 158,755
Total deposits 249,002 232,234
Borrowed funds
Federal funds purchased and repurchase agreements 1,777 3,510
Federal Home Loan Bank borrowings 20,108 20,005
Bank notes and senior debt 21,298 15,750
Subordinated debt 8,556 9,151
Commercial paper 14 4,995
Other (c) (d) 2,779 3,357
Total borrowed funds 54,532 56,768
Allowance for unfunded loan commitments and letters of credit 261 259
Accrued expenses (c) 4,975 5,187
Other (c) 3,743 4,550
Total liabilities 312,513 298,998
Equity
Preferred stock (e)
Common stock ($5 par value, authorized 800 shares, issued 542 and 541 shares) 2,708 2,705
Capital surplus – preferred stock 3,452 3,946
Capital surplus – common stock and other 12,745 12,627
Retained earnings 29,043 26,200
Accumulated other comprehensive income (loss) 130 503
Common stock held in treasury at cost: 38 and 18 shares (3,368) (1,430)
Total shareholders’ equity 44,710 44,551
Noncontrolling interests 1,270 1,523
Total equity 45,980 46,074
Total liabilities and equity $358,493 $345,072
(a) Our consolidated assets at December 31, 2015 included the following assets of certain variable interest entities (VIEs): Cash and due from banks of $11 million, Interest-earning
deposits with banks of $4 million, Net loans of $1.3 billion, Equity investments of $183 million, and Other assets of $402 million. Our consolidated assets at December 31, 2014
included the following assets of certain VIEs: Cash and due from banks of $6 million, Interest-earning deposits with banks of $6 million, Net loans of $1.6 billion, Equity investments
of $492 million, and Other assets of $483 million.
(b) Our consolidated assets at December 31, 2015 included the following for which we have elected the fair value option: Federal funds sold and resale agreements of $137 million, Loans
held for sale of $1.5 billion, Loans of $.9 billion, and Other assets of $521 million. Our consolidated assets at December 31, 2014 included the following for which we have elected the
fair value option: Federal funds sold and resale agreements of $155 million, Loans held for sale of $2.2 billion, Loans of $1.0 billion, and Other assets of $412 million.
(c) Our consolidated liabilities at December 31, 2015 included the following liabilities of certain VIEs: Other borrowed funds of $148 million, Accrued expenses of $44 million, and
Other liabilities of $202 million. Our consolidated liabilities at December 31, 2014 included the following liabilities of certain VIEs: Other borrowed funds of $347 million, Accrued
expenses of $70 million, and Other liabilities of $206 million.
(d) Our consolidated liabilities at December 31, 2015 and December 31, 2014 included Other borrowed funds of $93 million and $273 million, respectively, for which we have elected the
fair value option.
(e) Par value less than $.5 million at each date.
See accompanying Notes To Consolidated Financial Statements.
The PNC Financial Services Group, Inc. – Form 10-K 105