PNC Bank 2015 Annual Report Download - page 160
Download and view the complete annual report
Please find page 160 of the 2015 PNC Bank annual report below. You can navigate through the pages in the report by either clicking on the pages listed below, or by using the keyword search tool below to find specific information within the annual report.-
 1
1 -
 2
2 -
 3
3 -
 4
4 -
 5
5 -
 6
6 -
 7
7 -
 8
8 -
 9
9 -
 10
10 -
 11
11 -
 12
12 -
 13
13 -
 14
14 -
 15
15 -
 16
16 -
 17
17 -
 18
18 -
 19
19 -
 20
20 -
 21
21 -
 22
22 -
 23
23 -
 24
24 -
 25
25 -
 26
26 -
 27
27 -
 28
28 -
 29
29 -
 30
30 -
 31
31 -
 32
32 -
 33
33 -
 34
34 -
 35
35 -
 36
36 -
 37
37 -
 38
38 -
 39
39 -
 40
40 -
 41
41 -
 42
42 -
 43
43 -
 44
44 -
 45
45 -
 46
46 -
 47
47 -
 48
48 -
 49
49 -
 50
50 -
 51
51 -
 52
52 -
 53
53 -
 54
54 -
 55
55 -
 56
56 -
 57
57 -
 58
58 -
 59
59 -
 60
60 -
 61
61 -
 62
62 -
 63
63 -
 64
64 -
 65
65 -
 66
66 -
 67
67 -
 68
68 -
 69
69 -
 70
70 -
 71
71 -
 72
72 -
 73
73 -
 74
74 -
 75
75 -
 76
76 -
 77
77 -
 78
78 -
 79
79 -
 80
80 -
 81
81 -
 82
82 -
 83
83 -
 84
84 -
 85
85 -
 86
86 -
 87
87 -
 88
88 -
 89
89 -
 90
90 -
 91
91 -
 92
92 -
 93
93 -
 94
94 -
 95
95 -
 96
96 -
 97
97 -
 98
98 -
 99
99 -
 100
100 -
 101
101 -
 102
102 -
 103
103 -
 104
104 -
 105
105 -
 106
106 -
 107
107 -
 108
108 -
 109
109 -
 110
110 -
 111
111 -
 112
112 -
 113
113 -
 114
114 -
 115
115 -
 116
116 -
 117
117 -
 118
118 -
 119
119 -
 120
120 -
 121
121 -
 122
122 -
 123
123 -
 124
124 -
 125
125 -
 126
126 -
 127
127 -
 128
128 -
 129
129 -
 130
130 -
 131
131 -
 132
132 -
 133
133 -
 134
134 -
 135
135 -
 136
136 -
 137
137 -
 138
138 -
 139
139 -
 140
140 -
 141
141 -
 142
142 -
 143
143 -
 144
144 -
 145
145 -
 146
146 -
 147
147 -
 148
148 -
 149
149 -
 150
150 -
 151
151 -
 152
152 -
 153
153 -
 154
154 -
 155
155 -
 156
156 -
 157
157 -
 158
158 -
 159
159 -
 160
160 -
 161
161 -
 162
162 -
 163
163 -
 164
164 -
 165
165 -
 166
166 -
 167
167 -
 168
168 -
 169
169 -
 170
170 -
 171
171 -
 172
172 -
 173
173 -
 174
174 -
 175
175 -
 176
176 -
 177
177 -
 178
178 -
 179
179 -
 180
180 -
 181
181 -
 182
182 -
 183
183 -
 184
184 -
 185
185 -
 186
186 -
 187
187 -
 188
188 -
 189
189 -
 190
190 -
 191
191 -
 192
192 -
 193
193 -
 194
194 -
 195
195 -
 196
196 -
 197
197 -
 198
198 -
 199
199 -
 200
200 -
 201
201 -
 202
202 -
 203
203 -
 204
204 -
 205
205 -
 206
206 -
 207
207 -
 208
208 -
 209
209 -
 210
210 -
 211
211 -
 212
212 -
 213
213 -
 214
214 -
 215
215 -
 216
216 -
 217
217 -
 218
218 -
 219
219 -
 220
220 -
 221
221 -
 222
222 -
 223
223 -
 224
224 -
 225
225 -
 226
226 -
 227
227 -
 228
228 -
 229
229 -
 230
230 -
 231
231 -
 232
232 -
 233
233 -
 234
234 -
 235
235 -
 236
236 -
 237
237 -
 238
238 -
 239
239 -
 240
240 -
 241
241 -
 242
242 -
 243
243 -
 244
244 -
 245
245 -
 246
246 -
 247
247 -
 248
248 -
 249
249 -
 250
250 -
 251
251 -
 252
252 -
 253
253 -
 254
254 -
 255
255 -
 256
256
 |
 |

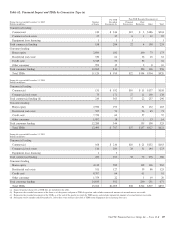
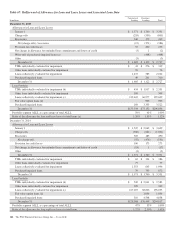
Table 67: Rollforward of Allowance for Loan and Lease Losses and Associated Loan Data
In millions
Commercial
Lending
Consumer
Lending Total
December 31, 2015
Allowance for Loan and Lease Losses
January 1 $ 1,571 $ 1,760 $ 3,331
Charge-offs (255) (550) (805)
Recoveries 240 179 419
Net (charge-offs) / recoveries (15) (371) (386)
Provision for credit losses 55 200 255
Net change in allowance for unfunded loan commitments and letters of credit (3) 1 (2)
Write-offs of purchased impaired loans (a) (468) (468)
Other (3) (3)
December 31 $ 1,605 $ 1,122 $ 2,727
TDRs individually evaluated for impairment $ 43 $ 276 $ 319
Other loans individually evaluated for impairment 76 76
Loans collectively evaluated for impairment 1,437 585 2,022
Purchased impaired loans 49 261 310
December 31 $ 1,605 $ 1,122 $ 2,727
Loan Portfolio
TDRs individually evaluated for impairment (b) $ 434 $ 1,917 $ 2,351
Other loans individually evaluated for impairment 309 309
Loans collectively evaluated for impairment (c) 132,632 66,977 199,609
Fair value option loans (d) 905 905
Purchased impaired loans 169 3,353 3,522
December 31 $133,544 $73,152 $206,696
Portfolio segment ALLL as a percentage of total ALLL 59% 41% 100%
Ratio of the allowance for loan and lease losses to total loans (a) 1.20% 1.53% 1.32%
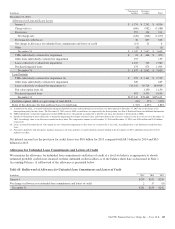
December 31, 2014
Allowance for Loan and Lease Losses
January 1 $ 1,547 $ 2,062 $ 3,609
Charge-offs (360) (661) (1,021)
Recoveries 305 185 490
Net charge-offs (55) (476) (531)
Provision for credit losses 100 173 273
Net change in allowance for unfunded loan commitments and letters of credit (18) 1 (17)
Other (3) (3)
December 31 $ 1,571 $ 1,760 $ 3,331
TDRs individually evaluated for impairment $ 62 $ 324 $ 386
Other loans individually evaluated for impairment 77 77
Loans collectively evaluated for impairment 1,353 643 1,996
Purchased impaired loans 79 793 872
December 31 $ 1,571 $ 1,760 $ 3,331
Loan Portfolio
TDRs individually evaluated for impairment (b) $ 542 $ 2,041 $ 2,583
Other loans individually evaluated for impairment 309 309
Loans collectively evaluated for impairment (c) 127,207 68,826 196,033
Fair value option loans (d) 1,034 1,034
Purchased impaired loans 310 4,548 4,858
December 31 $128,368 $76,449 $204,817
Portfolio segment ALLL as a percentage of total ALLL 47% 53% 100%
Ratio of the allowance for loan and lease losses to total loans 1.22% 2.30% 1.63%
142 The PNC Financial Services Group, Inc. – Form 10-K
