PNC Bank 2015 Annual Report Download - page 105
Download and view the complete annual report
Please find page 105 of the 2015 PNC Bank annual report below. You can navigate through the pages in the report by either clicking on the pages listed below, or by using the keyword search tool below to find specific information within the annual report.-
 1
1 -
2
-
3
-
4
-
5
-
6
-
7
-
8
-
9
-
10
-
11
-
12
-
13
-
14
-
15
-
16
-
17
-
18
-
19
-
20
-
21
-
22
-
23
-
24
-
25
-
26
-
27
-
28
-
29
-
30
-
31
-
32
-
33
-
34
-
35
-
36
-
37
-
38
-
39
-
40
-
41
-
42
-
43
-
44
-
45
-
46
-
47
-
48
-
49
-
50
-
51
-
52
-
53
-
54
-
55
-
56
-
57
-
58
-
59
-
60
-
61
-
62
-
63
-
64
-
65
-
66
-
67
-
68
-
69
-
70
-
71
-
72
-
73
-
74
-
75
-
76
-
77
-
78
-
79
-
80
-
81
-
82
-
83
-
84
-
85
-
86
-
87
-
88
-
89
-
90
-
91
-
92
-
93
-
94
-
 95
95 -
 96
96 -
 97
97 -
 98
98 -
 99
99 -
 100
100 -
 101
101 -
 102
102 -
 103
103 -
 104
104 -
 105
105 -
 106
106 -
 107
107 -
 108
108 -
 109
109 -
 110
110 -
 111
111 -
 112
112 -
 113
113 -
 114
114 -
 115
115 -
116
-
117
-
118
-
119
-
120
-
121
-
122
-
123
-
124
-
125
-
126
-
127
-
128
-
129
-
130
-
131
-
132
-
133
-
134
-
135
-
136
-
137
-
138
-
139
-
140
-
141
-
142
-
143
-
144
-
145
-
146
-
147
-
148
-
149
-
150
-
151
-
152
-
153
-
154
-
155
-
156
-
157
-
158
-
159
-
160
-
161
-
162
-
163
-
164
-
165
-
166
-
167
-
168
-
169
-
170
-
171
-
172
-
173
-
174
-
175
-
176
-
177
-
178
-
179
-
180
-
181
-
182
-
183
-
184
-
185
-
186
-
187
-
188
-
189
-
190
-
191
-
192
-
193
-
194
-
195
-
196
-
197
-
198
-
199
-
200
-
201
-
202
-
203
-
204
-
205
-
206
-
207
-
208
-
209
-
210
-
211
-
212
-
213
-
214
-
215
-
216
-
217
-
218
-
219
-
220
-
221
-
222
-
223
-
224
-
225
-
226
-
227
-
228
-
229
-
230
-
231
-
232
-
233
-
234
-
235
-
236
-
237
-
238
-
239
-
240
-
241
-
242
-
243
-
244
-
245
-
246
-
247
-
248
-
249
-
250
-
251
-
252
-
253
-
254
-
255
-
256
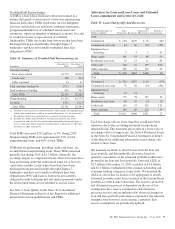
 |
 |

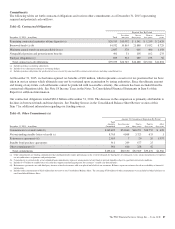
Commitments
The following tables set forth contractual obligations and various other commitments as of December 31, 2015 representing
required and potential cash outflows.
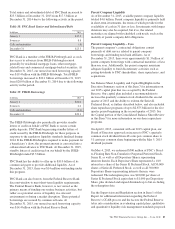
Table 42: Contractual Obligations
Payment Due By Period
December 31, 2015 – in millions Total
Less than
one year
One to
three years
Four to
five years
After five
years
Remaining contractual maturities of time deposits (a) $20,510 $15,092 $ 1,541 $ 1,249 $ 2,628
Borrowed funds (a) (b) 54,532 10,863 21,888 13,052 8,729
Minimum annual rentals on noncancellable leases 2,687 378 665 486 1,158
Nonqualified pension and postretirement benefits 491 51 105 102 233
Purchase obligations (c) 859 361 289 153 56
Total contractual cash obligations $79,079 $26,745 $24,488 $15,042 $12,804
(a) Includes purchase accounting adjustments.
(b) Includes basis adjustment relating to accounting hedges.
(c) Includes purchase obligations for goods and services covered by noncancellable contracts and contracts including cancellation fees.
At December 31, 2015, we had unrecognized tax benefits of $26 million, which represents a reserve for tax positions that we have
taken in our tax returns which ultimately may not be sustained upon examination by taxing authorities. Since the ultimate amount
and timing of any future cash settlements cannot be predicted with reasonable certainty, this estimate has been excluded from the
contractual obligations table. See Note 18 Income Taxes in the Notes To Consolidated Financial Statements in Item 8 of this
Report for additional information.
Our contractual obligations totaled $82.0 billion at December 31, 2014. The decrease in the comparison is primarily attributable to
declines in borrowed funds and time deposits. See Funding Sources in the Consolidated Balance Sheet Review section of this
Item 7 for additional information regarding our funding sources.
Table 43: Other Commitments (a)
Amount Of Commitment Expiration By Period
December 31, 2015 – in millions
Total
Amounts
Committed
Less than one
year
One to
three years
Four to
five years
After
five years
Commitments to extend credit (b) $142,489 $54,840 $48,291 $38,750 $ 608
Net outstanding standby letters of credit (c) 8,765 4,808 3,323 633 1
Reinsurance agreements (d) 2,010 7 20 26 1,957
Standby bond purchase agreements 911 209 677 25
Other commitments (e) 966 666 258 42
Total commitments $155,141 $60,530 $52,569 $39,476 $2,566
(a) Other commitments are funding commitments that could potentially require performance in the event of demands by third parties or contingent events. Loan commitments are reported
net of syndications, assignments and participations.
(b) Commitments to extend credit, or net unfunded loan commitments, represent arrangements to lend funds or provide liquidity subject to specified contractual conditions.
(c) Includes $4.7 billion of standby letters of credit that support remarketing programs for customers’ variable rate demand notes.
(d) Reinsurance agreements are with third-party insurers related to insurance sold to or placed on behalf of our customers. Balances represent estimates based on availability of financial
information.
(e) Includes other commitments of $216 million that were not on our Consolidated Balance Sheet. The remaining $750 million of other commitments were included in Other liabilities on
our Consolidated Balance Sheet.
The PNC Financial Services Group, Inc. – Form 10-K 87