PNC Bank 2015 Annual Report Download - page 92
Download and view the complete annual report
Please find page 92 of the 2015 PNC Bank annual report below. You can navigate through the pages in the report by either clicking on the pages listed below, or by using the keyword search tool below to find specific information within the annual report.-
 1
1 -
2
-
3
-
4
-
5
-
6
-
7
-
8
-
9
-
10
-
11
-
12
-
13
-
14
-
15
-
16
-
17
-
18
-
19
-
20
-
21
-
22
-
23
-
24
-
25
-
26
-
27
-
28
-
29
-
30
-
31
-
32
-
33
-
34
-
35
-
36
-
37
-
38
-
39
-
40
-
41
-
42
-
43
-
44
-
45
-
46
-
47
-
48
-
49
-
50
-
51
-
52
-
53
-
54
-
55
-
56
-
57
-
58
-
59
-
60
-
61
-
62
-
63
-
64
-
65
-
66
-
67
-
68
-
69
-
70
-
71
-
72
-
73
-
74
-
75
-
76
-
77
-
78
-
79
-
80
-
81
-
 82
82 -
 83
83 -
 84
84 -
 85
85 -
 86
86 -
 87
87 -
 88
88 -
 89
89 -
 90
90 -
 91
91 -
 92
92 -
 93
93 -
 94
94 -
 95
95 -
 96
96 -
 97
97 -
 98
98 -
 99
99 -
 100
100 -
 101
101 -
 102
102 -
103
-
104
-
105
-
106
-
107
-
108
-
109
-
110
-
111
-
112
-
113
-
114
-
115
-
116
-
117
-
118
-
119
-
120
-
121
-
122
-
123
-
124
-
125
-
126
-
127
-
128
-
129
-
130
-
131
-
132
-
133
-
134
-
135
-
136
-
137
-
138
-
139
-
140
-
141
-
142
-
143
-
144
-
145
-
146
-
147
-
148
-
149
-
150
-
151
-
152
-
153
-
154
-
155
-
156
-
157
-
158
-
159
-
160
-
161
-
162
-
163
-
164
-
165
-
166
-
167
-
168
-
169
-
170
-
171
-
172
-
173
-
174
-
175
-
176
-
177
-
178
-
179
-
180
-
181
-
182
-
183
-
184
-
185
-
186
-
187
-
188
-
189
-
190
-
191
-
192
-
193
-
194
-
195
-
196
-
197
-
198
-
199
-
200
-
201
-
202
-
203
-
204
-
205
-
206
-
207
-
208
-
209
-
210
-
211
-
212
-
213
-
214
-
215
-
216
-
217
-
218
-
219
-
220
-
221
-
222
-
223
-
224
-
225
-
226
-
227
-
228
-
229
-
230
-
231
-
232
-
233
-
234
-
235
-
236
-
237
-
238
-
239
-
240
-
241
-
242
-
243
-
244
-
245
-
246
-
247
-
248
-
249
-
250
-
251
-
252
-
253
-
254
-
255
-
256
 |
 |

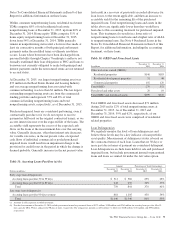
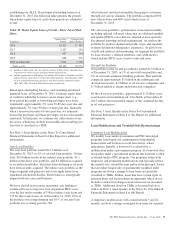
Total early stage loan delinquencies (accruing loans past due
30 to 89 days) decreased $82 million, or 10%, at
December 31, 2015 compared to December 31, 2014, driven
by reductions in consumer early stage delinquencies.
Accruing loans past due 90 days or more decreased $224
million, or 20%, at December 31, 2015 compared to
December 31, 2014 due to declines in government insured
residential real estate loans of $174 million, the majority of
which we took possession of and conveyed the real estate, or
are in the process of conveyance and claim resolution.
Accruing loans past due 90 days or more are referred to as late
stage loan delinquencies. These loans are not included in
nonperforming loans and continue to accrue interest because
they are well secured by collateral and are in the process of
collection, or are managed in homogenous portfolios with
specified charge-off timeframes adhering to regulatory
guidelines, or are certain government insured or guaranteed
loans.
On a regular basis our Special Asset Committee closely
monitors loans, primarily commercial loans, that are not
included in the nonperforming or accruing past due categories
and for which we are uncertain about the borrower’s ability to
comply with existing repayment terms. These loans totaled $.1
billion and $.2 billion at December 31, 2015 and
December 31, 2014, respectively.
See Note 1 Accounting Policies and Note 3 Asset Quality in
the Notes To Consolidated Financial Statements in Item 8 of
this Report for additional information regarding our
nonperforming loan and nonaccrual policies and further
information on loan delinquencies.
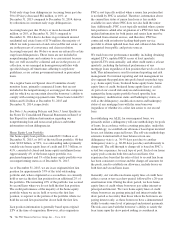
Home Equity Loan Portfolio
Our home equity loan portfolio totaled $32.1 billion as of
December 31, 2015, or 16% of the total loan portfolio. Of that
total, $18.8 billion, or 59%, was outstanding under primarily
variable-rate home equity lines of credit and $13.3 billion, or
41%, consisted of closed-end home equity installment loans.
Approximately 4% of the home equity portfolio was
purchased impaired and 3% of the home equity portfolio was
on nonperforming status as of December 31, 2015.
As of December 31, 2015, we are in an originated first lien
position for approximately 53% of the total outstanding
portfolio and, where originated as a second lien, we currently
hold or service the first lien position for an additional 2% of
the portfolio. The remaining 45% of the portfolio was secured
by second liens where we do not hold the first lien position.
The credit performance of the majority of the home equity
portfolio where we are in, hold or service the first lien
position, is superior to the portion of the portfolio where we
hold the second lien position but do not hold the first lien.
Lien position information is generally based upon original
LTV at the time of origination. However, after origination
PNC is not typically notified when a senior lien position that
is not held by PNC is satisfied. Therefore, information about
the current lien status of junior lien loans is less readily
available in cases where PNC does not also hold the senior
lien. Additionally, PNC is not typically notified when a junior
lien position is added after origination of a PNC first lien. This
updated information for both junior and senior liens must be
obtained from external sources, and therefore, PNC has
contracted with an industry-leading third-party service
provider to obtain updated loan, lien and collateral data that is
aggregated from public and private sources.
We track borrower performance monthly, including obtaining
original LTVs, updated FICO scores at least quarterly,
updated LTVs semi-annually, and other credit metrics at least
quarterly, including the historical performance of any
mortgage loans regardless of lien position that we do or do not
hold. This information is used for internal reporting and risk
management. For internal reporting and risk management we
also segment the population into pools based on product type
(e.g., home equity loans, brokered home equity loans, home
equity lines of credit, brokered home equity lines of credit).
As part of our overall risk analysis and monitoring, we
segment the home equity portfolio based upon the loan
delinquency, modification status and bankruptcy status, as
well as the delinquency, modification status and bankruptcy
status of any mortgage loan with the same borrower
(regardless of whether it is a first lien senior to our second
lien).
In establishing our ALLL for non-impaired loans, we
primarily utilize a delinquency roll-rate methodology for pools
of loans. In accordance with accounting principles, under this
methodology, we establish our allowance based upon incurred
losses, not lifetime expected losses. The roll-rate methodology
estimates transition/roll of loan balances from one
delinquency state (e.g., 30-59 days past due) to another
delinquency state (e.g., 60-89 days past due) and ultimately to
charge-off. The roll through to charge-off is based on PNC’s
actual loss experience for each type of pool. Each of our home
equity pools contains both first and second liens. Our
experience has been that the ratio of first to second lien loans
has been consistent over time and the charge-off amounts for
the pools, used to establish our allowance, include losses on
both first and second liens loans.
Generally, our variable-rate home equity lines of credit have
either a seven or ten year draw period, followed by a 20-year
amortization term. During the draw period, we have home
equity lines of credit where borrowers pay either interest or
principal and interest. We view home equity lines of credit
where borrowers are paying principal and interest under the
draw period as less risky than those where the borrowers are
paying interest only, as these borrowers have a demonstrated
ability to make some level of principal and interest payments.
The risk associated with the borrower’s ability to satisfy the
loan terms upon the draw period ending is considered in
74 The PNC Financial Services Group, Inc. – Form 10-K