PNC Bank 2015 Annual Report Download - page 121
Download and view the complete annual report
Please find page 121 of the 2015 PNC Bank annual report below. You can navigate through the pages in the report by either clicking on the pages listed below, or by using the keyword search tool below to find specific information within the annual report.-
 1
1 -
2
-
3
-
4
-
5
-
6
-
7
-
8
-
9
-
10
-
11
-
12
-
13
-
14
-
15
-
16
-
17
-
18
-
19
-
20
-
21
-
22
-
23
-
24
-
25
-
26
-
27
-
28
-
29
-
30
-
31
-
32
-
33
-
34
-
35
-
36
-
37
-
38
-
39
-
40
-
41
-
42
-
43
-
44
-
45
-
46
-
47
-
48
-
49
-
50
-
51
-
52
-
53
-
54
-
55
-
56
-
57
-
58
-
59
-
60
-
61
-
62
-
63
-
64
-
65
-
66
-
67
-
68
-
69
-
70
-
71
-
72
-
73
-
74
-
75
-
76
-
77
-
78
-
79
-
80
-
81
-
82
-
83
-
84
-
85
-
86
-
87
-
88
-
89
-
90
-
91
-
92
-
93
-
94
-
95
-
96
-
97
-
98
-
99
-
100
-
101
-
102
-
103
-
104
-
105
-
106
-
107
-
108
-
109
-
110
-
 111
111 -
 112
112 -
 113
113 -
 114
114 -
 115
115 -
 116
116 -
 117
117 -
 118
118 -
 119
119 -
 120
120 -
 121
121 -
 122
122 -
 123
123 -
 124
124 -
 125
125 -
 126
126 -
 127
127 -
 128
128 -
 129
129 -
 130
130 -
 131
131 -
132
-
133
-
134
-
135
-
136
-
137
-
138
-
139
-
140
-
141
-
142
-
143
-
144
-
145
-
146
-
147
-
148
-
149
-
150
-
151
-
152
-
153
-
154
-
155
-
156
-
157
-
158
-
159
-
160
-
161
-
162
-
163
-
164
-
165
-
166
-
167
-
168
-
169
-
170
-
171
-
172
-
173
-
174
-
175
-
176
-
177
-
178
-
179
-
180
-
181
-
182
-
183
-
184
-
185
-
186
-
187
-
188
-
189
-
190
-
191
-
192
-
193
-
194
-
195
-
196
-
197
-
198
-
199
-
200
-
201
-
202
-
203
-
204
-
205
-
206
-
207
-
208
-
209
-
210
-
211
-
212
-
213
-
214
-
215
-
216
-
217
-
218
-
219
-
220
-
221
-
222
-
223
-
224
-
225
-
226
-
227
-
228
-
229
-
230
-
231
-
232
-
233
-
234
-
235
-
236
-
237
-
238
-
239
-
240
-
241
-
242
-
243
-
244
-
245
-
246
-
247
-
248
-
249
-
250
-
251
-
252
-
253
-
254
-
255
-
256
 |
 |

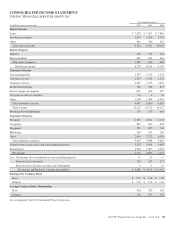
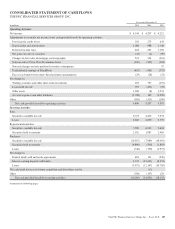
CONSOLIDATED INCOME STATEMENT
THE PNC FINANCIAL SERVICES GROUP, INC.
Year ended December 31
In millions, except per share data 2015 2014 2013
Interest Income
Loans $ 7,203 $ 7,427 $ 7,866
Investment securities 1,679 1,624 1,749
Other 441 380 392
Total interest income 9,323 9,431 10,007
Interest Expense
Deposits 403 325 344
Borrowed funds 642 581 516
Total interest expense 1,045 906 860
Net interest income 8,278 8,525 9,147
Noninterest Income
Asset management 1,567 1,513 1,342
Consumer services 1,335 1,254 1,253
Corporate services 1,491 1,415 1,210
Residential mortgage 566 618 871
Service charges on deposits 651 662 597
Net gains on sales of securities 43 4 99
Other 1,294 1,384 1,493
Total noninterest income 6,947 6,850 6,865
Total revenue 15,225 15,375 16,012
Provision For Credit Losses 255 273 643
Noninterest Expense
Personnel 4,831 4,611 4,743
Occupancy 842 833 833
Equipment 925 859 763
Marketing 249 253 246
Other 2,616 2,932 3,096
Total noninterest expense 9,463 9,488 9,681
Income before income taxes and noncontrolling interests 5,507 5,614 5,688
Income taxes 1,364 1,407 1,476
Net income 4,143 4,207 4,212
Less: Net income (loss) attributable to noncontrolling interests 37 23 11
Preferred stock dividends 220 232 237
Preferred stock discount accretion and redemptions 5 5 12
Net income attributable to common shareholders $ 3,881 $ 3,947 $ 3,952
Earnings Per Common Share
Basic $ 7.52 $ 7.44 $ 7.45
Diluted $ 7.39 $ 7.30 $ 7.36
Average Common Shares Outstanding
Basic 514 529 528
Diluted 521 537 532
See accompanying Notes To Consolidated Financial Statements.
The PNC Financial Services Group, Inc. – Form 10-K 103