PNC Bank 2015 Annual Report Download - page 75
Download and view the complete annual report
Please find page 75 of the 2015 PNC Bank annual report below. You can navigate through the pages in the report by either clicking on the pages listed below, or by using the keyword search tool below to find specific information within the annual report.-
 1
1 -
2
-
3
-
4
-
5
-
6
-
7
-
8
-
9
-
10
-
11
-
12
-
13
-
14
-
15
-
16
-
17
-
18
-
19
-
20
-
21
-
22
-
23
-
24
-
25
-
26
-
27
-
28
-
29
-
30
-
31
-
32
-
33
-
34
-
35
-
36
-
37
-
38
-
39
-
40
-
41
-
42
-
43
-
44
-
45
-
46
-
47
-
48
-
49
-
50
-
51
-
52
-
53
-
54
-
55
-
56
-
57
-
58
-
59
-
60
-
61
-
62
-
63
-
64
-
 65
65 -
 66
66 -
 67
67 -
 68
68 -
 69
69 -
 70
70 -
 71
71 -
 72
72 -
 73
73 -
 74
74 -
 75
75 -
 76
76 -
 77
77 -
 78
78 -
 79
79 -
 80
80 -
 81
81 -
 82
82 -
 83
83 -
 84
84 -
 85
85 -
86
-
87
-
88
-
89
-
90
-
91
-
92
-
93
-
94
-
95
-
96
-
97
-
98
-
99
-
100
-
101
-
102
-
103
-
104
-
105
-
106
-
107
-
108
-
109
-
110
-
111
-
112
-
113
-
114
-
115
-
116
-
117
-
118
-
119
-
120
-
121
-
122
-
123
-
124
-
125
-
126
-
127
-
128
-
129
-
130
-
131
-
132
-
133
-
134
-
135
-
136
-
137
-
138
-
139
-
140
-
141
-
142
-
143
-
144
-
145
-
146
-
147
-
148
-
149
-
150
-
151
-
152
-
153
-
154
-
155
-
156
-
157
-
158
-
159
-
160
-
161
-
162
-
163
-
164
-
165
-
166
-
167
-
168
-
169
-
170
-
171
-
172
-
173
-
174
-
175
-
176
-
177
-
178
-
179
-
180
-
181
-
182
-
183
-
184
-
185
-
186
-
187
-
188
-
189
-
190
-
191
-
192
-
193
-
194
-
195
-
196
-
197
-
198
-
199
-
200
-
201
-
202
-
203
-
204
-
205
-
206
-
207
-
208
-
209
-
210
-
211
-
212
-
213
-
214
-
215
-
216
-
217
-
218
-
219
-
220
-
221
-
222
-
223
-
224
-
225
-
226
-
227
-
228
-
229
-
230
-
231
-
232
-
233
-
234
-
235
-
236
-
237
-
238
-
239
-
240
-
241
-
242
-
243
-
244
-
245
-
246
-
247
-
248
-
249
-
250
-
251
-
252
-
253
-
254
-
255
-
256
 |
 |

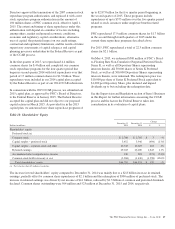
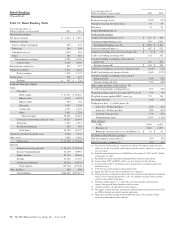
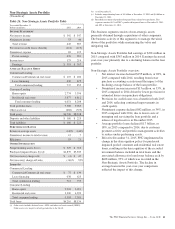
Asset Management Group
(Unaudited)
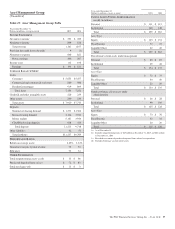
Table 23: Asset Management Group Table
Year ended December 31
Dollars in millions, except as noted 2015 2014
I
NCOME
S
TATEMENT
Net interest income $ 292 $ 289
Noninterest income 869 818
Total revenue 1,161 1,107
Provision for credit losses (benefit) 9 (1)
Noninterest expense 846 821
Pretax earnings 306 287
Income taxes 112 106
Earnings $ 194 $ 181
A
VERAGE
B
ALANCE
S
HEET
Loans
Consumer $ 5,655 $5,457
Commercial and commercial real estate 880 986
Residential mortgage 919 809
Total loans 7,454 7,252
Goodwill and other intangible assets 226 259
Other assets 240 234
Total assets $ 7,920 $7,745
Deposits
Noninterest-bearing demand $ 1,272 $1,366
Interest-bearing demand 4,144 3,954
Money market 5,161 3,944
CDs/IRAs/savings deposits 638 454
Total deposits 11,215 9,718
Other liabilities 42 51
Total liabilities $11,257 $9,769
P
ERFORMANCE
R
ATIOS
Return on average assets 2.45% 2.34%
Noninterest income to total revenue 75 74
Efficiency 73 74
O
THER
I
NFORMATION
Total nonperforming assets (a) (b) $ 53 $ 66
Purchased impaired loans (a) (c) $ 72 $ 83
Total net charge-offs $ 13 $ 3
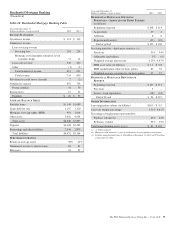
Year ended December 31
Dollars in millions, except as noted 2015 2014
C
LIENT
A
SSETS
U
NDER
A
DMINISTRATION
(a) (d) (in billions)
Personal $ 111 $ 115
Institutional 148 148
Total $ 259 $ 263
Asset Type
Equity $ 145 $ 151
Fixed Income 72 72
Liquidity/Other 42 40
Total $ 259 $ 263
Discretionary client assets under management
Personal $ 85 $ 87
Institutional 49 48
Total $ 134 $ 135
Asset Type
Equity $ 72 $ 75
Fixed Income 40 40
Liquidity/Other 22 20
Total $ 134 $ 135
Nondiscretionary client assets under
administration
Personal $ 26 $ 28
Institutional 99 100
Total $ 125 $ 128
Asset Type
Equity $ 73 $ 76
Fixed Income 32 32
Liquidity/Other 20 20
Total $ 125 $ 128
(a) As of December 31.
(b) Includes nonperforming loans of $48 million at December 31, 2015 and $62 million
at December 31, 2014.
(c) Recorded investment of purchased impaired loans related to acquisitions.
(d) Excludes brokerage account client assets.
The PNC Financial Services Group, Inc. – Form 10-K 57