PNC Bank 2015 Annual Report Download - page 112
Download and view the complete annual report
Please find page 112 of the 2015 PNC Bank annual report below. You can navigate through the pages in the report by either clicking on the pages listed below, or by using the keyword search tool below to find specific information within the annual report.-
 1
1 -
2
-
3
-
4
-
5
-
6
-
7
-
8
-
9
-
10
-
11
-
12
-
13
-
14
-
15
-
16
-
17
-
18
-
19
-
20
-
21
-
22
-
23
-
24
-
25
-
26
-
27
-
28
-
29
-
30
-
31
-
32
-
33
-
34
-
35
-
36
-
37
-
38
-
39
-
40
-
41
-
42
-
43
-
44
-
45
-
46
-
47
-
48
-
49
-
50
-
51
-
52
-
53
-
54
-
55
-
56
-
57
-
58
-
59
-
60
-
61
-
62
-
63
-
64
-
65
-
66
-
67
-
68
-
69
-
70
-
71
-
72
-
73
-
74
-
75
-
76
-
77
-
78
-
79
-
80
-
81
-
82
-
83
-
84
-
85
-
86
-
87
-
88
-
89
-
90
-
91
-
92
-
93
-
94
-
95
-
96
-
97
-
98
-
99
-
100
-
101
-
 102
102 -
 103
103 -
 104
104 -
 105
105 -
 106
106 -
 107
107 -
 108
108 -
 109
109 -
 110
110 -
 111
111 -
 112
112 -
 113
113 -
 114
114 -
 115
115 -
 116
116 -
 117
117 -
 118
118 -
 119
119 -
 120
120 -
 121
121 -
 122
122 -
123
-
124
-
125
-
126
-
127
-
128
-
129
-
130
-
131
-
132
-
133
-
134
-
135
-
136
-
137
-
138
-
139
-
140
-
141
-
142
-
143
-
144
-
145
-
146
-
147
-
148
-
149
-
150
-
151
-
152
-
153
-
154
-
155
-
156
-
157
-
158
-
159
-
160
-
161
-
162
-
163
-
164
-
165
-
166
-
167
-
168
-
169
-
170
-
171
-
172
-
173
-
174
-
175
-
176
-
177
-
178
-
179
-
180
-
181
-
182
-
183
-
184
-
185
-
186
-
187
-
188
-
189
-
190
-
191
-
192
-
193
-
194
-
195
-
196
-
197
-
198
-
199
-
200
-
201
-
202
-
203
-
204
-
205
-
206
-
207
-
208
-
209
-
210
-
211
-
212
-
213
-
214
-
215
-
216
-
217
-
218
-
219
-
220
-
221
-
222
-
223
-
224
-
225
-
226
-
227
-
228
-
229
-
230
-
231
-
232
-
233
-
234
-
235
-
236
-
237
-
238
-
239
-
240
-
241
-
242
-
243
-
244
-
245
-
246
-
247
-
248
-
249
-
250
-
251
-
252
-
253
-
254
-
255
-
256
 |
 |
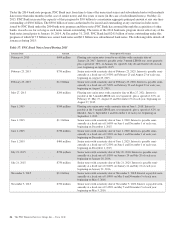
Loans Held For Sale
Loans held for sale totaled $2.3 billion at both December 31,
2014 and December 31, 2013.
For commercial mortgages held for sale designated at fair
value, the balance relating to these loans was $893 million at
December 31, 2014 compared to $586 million at
December 31, 2013. For commercial mortgages held for sale
carried at lower of cost or fair value, we sold $3.5 billion in
2014 compared to $2.8 billion in 2013. Total gains of $80
million were recognized on the valuation and sale of
commercial mortgage loans held for sale, net of hedges, in
2014, and $79 million in 2013.
Residential mortgage loan origination volume was $9.5 billion
in 2014 compared to $15.1 billion in 2013. The majority of
such loans were originated under agency or Federal Housing
Administration (FHA) standards. We sold $8.3 billion of loans
and recognized loan sales revenue of $420 million in 2014.
The comparable amounts for 2013 were $14.7 billion and
$568 million, respectively.
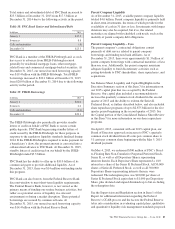
Asset Quality
Overall asset quality trends in 2014 improved from 2013.
Nonperforming assets decreased $.6 billion, or 17%, to $2.9
billion at December 31, 2014 compared to December 31,
2013. Nonperforming assets to total assets were 0.83% at
December 31, 2014, compared to 1.08% at December 31,
2013. Overall loan delinquencies of $1.9 billion at
December 31, 2014 decreased $.5 billion, or 22%, compared
with December 31, 2013. Net charge-offs of $.5 billion in
2014 declined 51% compared to net charge-offs of $1.1
billion for 2013. Net charge-offs were 0.27% of average loans
in 2014 and 0.57% of average loans in 2013.
The net charge-off comparisons above were impacted by
alignment with interagency guidance in the first quarter of
2013 on practices for loans and lines of credit related to
consumer lending. In the first quarter 2013, this alignment had
the overall effect of (i) accelerating charge-offs, (ii) increasing
nonperforming loans and (iii) in the case of loans accounted
for under the fair value option, increasing nonaccrual loans.
The ALLL was $3.3 billion, or 1.63% of total loans and 133%
of nonperforming loans, as of December 31, 2014, compared
to $3.6 billion, or 1.84% of total loans and 117% of
nonperforming loans, as of December 31, 2013.
At December 31, 2014, our largest nonperforming asset was
$35 million in the Real Estate, Rental and Leasing Industry
and our average nonperforming loans associated with
commercial lending were under $1 million.
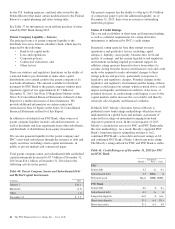
Funding Sources
Total funding sources increased $22.0 billion to $289.0 billion
at December 31, 2014 compared with December 31, 2013.
Total deposits increased $11.3 billion to $232.2 billion at
December 31, 2014 compared with December 31, 2013 due to
strong growth in demand and money market, partially offset
by lower retail certificates of deposit. Interest-bearing deposits
represented 68% of total deposits at both December 31, 2014
and December 31, 2013.
Average total deposits increased $10.8 billion to $222.9
billion in 2014 compared with the prior year. Higher average
money market deposits, average noninterest-bearing deposits,
and average interest-bearing demand deposits drove the
increase in both commercial and consumer average deposits.
These increases were partially offset by a decrease of $2.6
billion in average retail certificates of deposit attributable to
runoff of maturing accounts. Average total deposits
represented 68% of average total assets for 2014 and 69% for
2013.
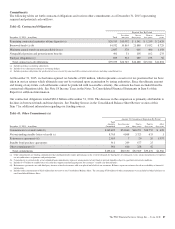
Total borrowed funds increased $10.7 billion to $56.8 billion
at December 31, 2014 compared with December 31, 2013 as
higher Federal Home Loan Bank (FHLB) borrowings and
issuances of bank notes and senior debt and subordinated debt
were partially offset by a decline in federal funds purchased
and repurchase agreements.
Average borrowed funds were $48.8 billion in 2014 compared
with $40.0 billion in 2013. The increase was primarily due to
increases in average FHLB borrowings, average bank notes
and senior debt, and average subordinated debt, in part to
enhance our liquidity position. These increases were partially
offset by a decline in average commercial paper.
94 The PNC Financial Services Group, Inc. – Form 10-K