PNC Bank 2015 Annual Report Download - page 152
Download and view the complete annual report
Please find page 152 of the 2015 PNC Bank annual report below. You can navigate through the pages in the report by either clicking on the pages listed below, or by using the keyword search tool below to find specific information within the annual report.-
 1
1 -
2
-
3
-
4
-
5
-
6
-
7
-
8
-
9
-
10
-
11
-
12
-
13
-
14
-
15
-
16
-
17
-
18
-
19
-
20
-
21
-
22
-
23
-
24
-
25
-
26
-
27
-
28
-
29
-
30
-
31
-
32
-
33
-
34
-
35
-
36
-
37
-
38
-
39
-
40
-
41
-
42
-
43
-
44
-
45
-
46
-
47
-
48
-
49
-
50
-
51
-
52
-
53
-
54
-
55
-
56
-
57
-
58
-
59
-
60
-
61
-
62
-
63
-
64
-
65
-
66
-
67
-
68
-
69
-
70
-
71
-
72
-
73
-
74
-
75
-
76
-
77
-
78
-
79
-
80
-
81
-
82
-
83
-
84
-
85
-
86
-
87
-
88
-
89
-
90
-
91
-
92
-
93
-
94
-
95
-
96
-
97
-
98
-
99
-
100
-
101
-
102
-
103
-
104
-
105
-
106
-
107
-
108
-
109
-
110
-
111
-
112
-
113
-
114
-
115
-
116
-
117
-
118
-
119
-
120
-
121
-
122
-
123
-
124
-
125
-
126
-
127
-
128
-
129
-
130
-
131
-
132
-
133
-
134
-
135
-
136
-
137
-
138
-
139
-
140
-
141
-
 142
142 -
 143
143 -
 144
144 -
 145
145 -
 146
146 -
 147
147 -
 148
148 -
 149
149 -
 150
150 -
 151
151 -
 152
152 -
 153
153 -
 154
154 -
 155
155 -
 156
156 -
 157
157 -
 158
158 -
 159
159 -
 160
160 -
 161
161 -
 162
162 -
163
-
164
-
165
-
166
-
167
-
168
-
169
-
170
-
171
-
172
-
173
-
174
-
175
-
176
-
177
-
178
-
179
-
180
-
181
-
182
-
183
-
184
-
185
-
186
-
187
-
188
-
189
-
190
-
191
-
192
-
193
-
194
-
195
-
196
-
197
-
198
-
199
-
200
-
201
-
202
-
203
-
204
-
205
-
206
-
207
-
208
-
209
-
210
-
211
-
212
-
213
-
214
-
215
-
216
-
217
-
218
-
219
-
220
-
221
-
222
-
223
-
224
-
225
-
226
-
227
-
228
-
229
-
230
-
231
-
232
-
233
-
234
-
235
-
236
-
237
-
238
-
239
-
240
-
241
-
242
-
243
-
244
-
245
-
246
-
247
-
248
-
249
-
250
-
251
-
252
-
253
-
254
-
255
-
256
 |
 |

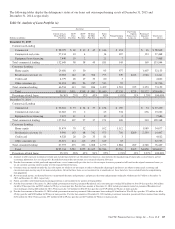
(continued from previous page)
Home Equity (b) (c ) Residential Real Estate (b) (c)
December 31, 2014 – in millions 1st Liens 2nd Liens Total
Current estimated LTV ratios (d)
Greater than or equal to 125% and updated FICO scores:
Greater than 660 $ 8 $ 243 $ 276 $ 527
Less than or equal to 660 9 125 144 278
Missing FICO 8614
Greater than or equal to 100% to less than 125% and updated FICO scores:
Greater than 660 15 426 272 713
Less than or equal to 660 12 194 200 406
Missing FICO 11 5 16
Greater than or equal to 90% to less than 100% and updated FICO scores:
Greater than 660 12 207 186 405
Less than or equal to 660 9 93 123 225
Missing FICO 538
Less than 90% and updated FICO scores:
Greater than 660 102 339 626 1,067
Less than or equal to 660 109 200 515 824
Missing FICO 1 12 15 28
Missing LTV and updated FICO scores:
Greater than 660 1 14 15
Less than or equal to 660 4 10 14
Missing FICO 11
Total home equity and residential real estate loans $282 $1,863 $2,396 $4,541
(a) Amounts shown represent outstanding balance. See Note 4 Purchased Loans for additional information.
(b) For the estimate of cash flows utilized in our purchased impaired loan accounting, other assumptions and estimates are made, including amortization of first lien balances, pre-payment
rates, etc., which are not reflected in this table.
(c) The following states had the highest percentage of purchased impaired loans at December 31, 2015: California 16%, Florida 14%, Illinois 11%, Ohio 9%, North Carolina 7%, and
Michigan 5%. The remainder of the states had lower than a 4% concentration of purchased impaired loans individually, and collectively they represent approximately 38% of the
purchased impaired portfolio. The following states had the highest percentage of purchased impaired loans at December 31, 2014: California 17%, Florida 15%, Illinois 11%, Ohio
8%, North Carolina 7% and Michigan 5%. The remainder of the states had lower than a 4% concentration of purchased impaired loans individually, and collectively they represent
approximately 37% of the purchased impaired portfolio.
(d) Based upon updated LTV (inclusive of combined loan-to-value (CLTV) for first and subordinate lien positions). Updated LTV is estimated using modeled property values. These
ratios are updated at least semi-annually. The related estimates and inputs are based upon an approach that uses a combination of third-party automated valuation models (AVMs),
broker price opinions (BPOs), HPI indices, property location, internal and external balance information, origination data and management assumptions. We generally utilize
origination lien balances provided by a third-party, where applicable, which do not include an amortization assumption when calculating updated LTV. Accordingly, the results of
these calculations do not represent actual appraised loan level collateral or updated LTV based upon lien balances held by others, and as such, are necessarily imprecise and subject to
change as we enhance our methodology.
134 The PNC Financial Services Group, Inc. – Form 10-K