PNC Bank 2015 Annual Report Download - page 169
Download and view the complete annual report
Please find page 169 of the 2015 PNC Bank annual report below. You can navigate through the pages in the report by either clicking on the pages listed below, or by using the keyword search tool below to find specific information within the annual report.-
 1
1 -
2
-
3
-
4
-
5
-
6
-
7
-
8
-
9
-
10
-
11
-
12
-
13
-
14
-
15
-
16
-
17
-
18
-
19
-
20
-
21
-
22
-
23
-
24
-
25
-
26
-
27
-
28
-
29
-
30
-
31
-
32
-
33
-
34
-
35
-
36
-
37
-
38
-
39
-
40
-
41
-
42
-
43
-
44
-
45
-
46
-
47
-
48
-
49
-
50
-
51
-
52
-
53
-
54
-
55
-
56
-
57
-
58
-
59
-
60
-
61
-
62
-
63
-
64
-
65
-
66
-
67
-
68
-
69
-
70
-
71
-
72
-
73
-
74
-
75
-
76
-
77
-
78
-
79
-
80
-
81
-
82
-
83
-
84
-
85
-
86
-
87
-
88
-
89
-
90
-
91
-
92
-
93
-
94
-
95
-
96
-
97
-
98
-
99
-
100
-
101
-
102
-
103
-
104
-
105
-
106
-
107
-
108
-
109
-
110
-
111
-
112
-
113
-
114
-
115
-
116
-
117
-
118
-
119
-
120
-
121
-
122
-
123
-
124
-
125
-
126
-
127
-
128
-
129
-
130
-
131
-
132
-
133
-
134
-
135
-
136
-
137
-
138
-
139
-
140
-
141
-
142
-
143
-
144
-
145
-
146
-
147
-
148
-
149
-
150
-
151
-
152
-
153
-
154
-
155
-
156
-
157
-
158
-
 159
159 -
 160
160 -
 161
161 -
 162
162 -
 163
163 -
 164
164 -
 165
165 -
 166
166 -
 167
167 -
 168
168 -
 169
169 -
 170
170 -
 171
171 -
 172
172 -
 173
173 -
 174
174 -
 175
175 -
 176
176 -
 177
177 -
 178
178 -
 179
179 -
180
-
181
-
182
-
183
-
184
-
185
-
186
-
187
-
188
-
189
-
190
-
191
-
192
-
193
-
194
-
195
-
196
-
197
-
198
-
199
-
200
-
201
-
202
-
203
-
204
-
205
-
206
-
207
-
208
-
209
-
210
-
211
-
212
-
213
-
214
-
215
-
216
-
217
-
218
-
219
-
220
-
221
-
222
-
223
-
224
-
225
-
226
-
227
-
228
-
229
-
230
-
231
-
232
-
233
-
234
-
235
-
236
-
237
-
238
-
239
-
240
-
241
-
242
-
243
-
244
-
245
-
246
-
247
-
248
-
249
-
250
-
251
-
252
-
253
-
254
-
255
-
256
 |
 |
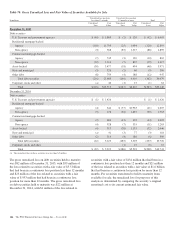
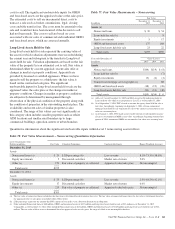
Certain infrequently traded debt securities within the State and
municipal and Other debt securities available-for-sale and
Trading securities categories are also classified in Level 3 and
are included in the Insignificant Level 3 assets, net of
liabilities line item in Table 76 (for the 2015 period). The
significant unobservable inputs used to estimate the fair value
of these securities include an estimate of expected credit
losses and a discount for liquidity risk. These inputs are
incorporated into the fair value measurement by either
increasing the spread over the benchmark curve or by
applying a credit and liquidity discount to the par value of the
security. Significant increases (decreases) in credit and/or
liquidity risk could result in a significantly lower (higher) fair
value estimate.
Financial Derivatives
Exchange-traded derivatives are valued using quoted market
prices and are classified as Level 1. However, the majority of
derivatives that we enter into are executed over-the-counter
and are valued using internal models. These derivatives are
primarily classified as Level 2 as the readily observable
market inputs to these models are validated to external
sources. The external sources for these inputs include industry
pricing services, or are corroborated through recent trades,
dealer quotes, yield curves, implied volatility or other market-
related data. Level 2 financial derivatives are primarily
estimated using a combination of Eurodollar future prices and
observable benchmark interest rate swaps to construct
projected discounted cash flows. Financial derivatives that are
priced using significant management judgment or assumptions
are classified as Level 3.
Fair value information for Level 3 financial derivatives is
presented separately for interest rate contracts and other
contracts. Interest rate contracts include residential and
commercial mortgage interest rate lock commitments and
certain interest rate options. Other contracts include risk
participation agreements, swaps related to the sale of certain
Visa Class B common shares and other types of contracts.
The fair values of residential mortgage loan commitment
assets as of December 31, 2015 and 2014 are included in the
Insignificant Level 3 assets, net of liabilities line item in
Table 76 in this Note 7. Significant unobservable inputs for
these commitments include the probability of funding and
embedded servicing. The probability of funding for residential
mortgage loan commitments represents the expected
proportion of loan commitments in the pipeline that will fund.
Additionally, embedded in the market price of the underlying
loan is a value for retaining servicing of the loan once it is
sold. Significant increases (decreases) in the fair value of a
residential mortgage loan commitment asset (liability) result
when the probability of funding increases (decreases) and
when the embedded servicing value increases (decreases).
The fair values of commercial mortgage loan commitment
assets and liabilities as of December 31, 2015 and 2014 are
included in the Insignificant Level 3 assets, net of liabilities
line item in Table 76 in this Note 7. Significant unobservable
inputs for these commitments include spread over the
benchmark interest rate and the estimated servicing cash flows
for loans sold to the agencies with servicing retained. The
spread over the benchmark curve reflects management
assumptions regarding credit and liquidity risks. Significant
increases (decreases) in the fair value of commercial mortgage
loan commitments result when the spread over the benchmark
curve decreases (increases) or the estimated servicing cash
flows for loans sold to the agencies with servicing retained
increases (decreases).
The fair values of interest rate option assets and liabilities as
of December 31, 2015 and 2014 are included in the
Insignificant Level 3 assets, net of liabilities line item in
Table 76 in this Note 7. The significant unobservable input
used in the fair value measurement of the interest rate options
is expected interest rate volatility. Significant increases
(decreases) in interest rate volatility would result in a
significantly higher (lower) fair value measurement.
The fair values of risk participation agreement assets and
liabilities as of December 31, 2015 and 2014 are included in
the Insignificant Level 3 assets, net of liabilities line item in
Table 76 in this Note 7. The significant unobservable inputs
used in the fair value measurement of risk participation
agreements are probability of default and loss severity.
Significant increases (decreases) in probability of default and
loss severity would result in a significantly higher (lower) fair
value measurement.
In connection with the sales of portions of our Visa Class B
common shares, we entered into swap agreements with the
purchasers of the shares to account for any future risk of
converting Class B common shares to Class A common shares
and to account for the corresponding change in value to the
Class B shares. These adjustments result from resolution of
the specified litigation or the changes in the amount in the
litigation escrow account funded by Visa as well as from
changes in the estimated litigation resolution date (see Note 20
Legal Proceedings and Note 21 Commitments and Guarantees
for additional information). These swaps also require
payments calculated by reference to the market price of the
Class A common shares and a fixed rate of interest. The swaps
are classified as Level 3 instruments and the fair values of the
liability positions totaled $104 million at December 31, 2015
and $135 million at December 31, 2014, respectively. The fair
values of the swap agreements are determined using a
discounted cash flow methodology. The significant
unobservable inputs to the valuations are estimated changes in
the conversion rate of the Class B common shares into
Class A common shares and the estimated growth rate of the
Class A share price. A decrease in the conversion rate will
have a negative impact on the fair value of the swaps and vice
versa. Independent of changes in the conversion rate, an
increase in the estimated growth rate of the Class A share
The PNC Financial Services Group, Inc. – Form 10-K 151