PNC Bank 2015 Annual Report Download - page 235
Download and view the complete annual report
Please find page 235 of the 2015 PNC Bank annual report below. You can navigate through the pages in the report by either clicking on the pages listed below, or by using the keyword search tool below to find specific information within the annual report.-
 1
1 -
2
-
3
-
4
-
5
-
6
-
7
-
8
-
9
-
10
-
11
-
12
-
13
-
14
-
15
-
16
-
17
-
18
-
19
-
20
-
21
-
22
-
23
-
24
-
25
-
26
-
27
-
28
-
29
-
30
-
31
-
32
-
33
-
34
-
35
-
36
-
37
-
38
-
39
-
40
-
41
-
42
-
43
-
44
-
45
-
46
-
47
-
48
-
49
-
50
-
51
-
52
-
53
-
54
-
55
-
56
-
57
-
58
-
59
-
60
-
61
-
62
-
63
-
64
-
65
-
66
-
67
-
68
-
69
-
70
-
71
-
72
-
73
-
74
-
75
-
76
-
77
-
78
-
79
-
80
-
81
-
82
-
83
-
84
-
85
-
86
-
87
-
88
-
89
-
90
-
91
-
92
-
93
-
94
-
95
-
96
-
97
-
98
-
99
-
100
-
101
-
102
-
103
-
104
-
105
-
106
-
107
-
108
-
109
-
110
-
111
-
112
-
113
-
114
-
115
-
116
-
117
-
118
-
119
-
120
-
121
-
122
-
123
-
124
-
125
-
126
-
127
-
128
-
129
-
130
-
131
-
132
-
133
-
134
-
135
-
136
-
137
-
138
-
139
-
140
-
141
-
142
-
143
-
144
-
145
-
146
-
147
-
148
-
149
-
150
-
151
-
152
-
153
-
154
-
155
-
156
-
157
-
158
-
159
-
160
-
161
-
162
-
163
-
164
-
165
-
166
-
167
-
168
-
169
-
170
-
171
-
172
-
173
-
174
-
175
-
176
-
177
-
178
-
179
-
180
-
181
-
182
-
183
-
184
-
185
-
186
-
187
-
188
-
189
-
190
-
191
-
192
-
193
-
194
-
195
-
196
-
197
-
198
-
199
-
200
-
201
-
202
-
203
-
204
-
205
-
206
-
207
-
208
-
209
-
210
-
211
-
212
-
213
-
214
-
215
-
216
-
217
-
218
-
219
-
220
-
221
-
222
-
223
-
224
-
 225
225 -
 226
226 -
 227
227 -
 228
228 -
 229
229 -
 230
230 -
 231
231 -
 232
232 -
 233
233 -
 234
234 -
 235
235 -
 236
236 -
 237
237 -
 238
238 -
 239
239 -
 240
240 -
 241
241 -
 242
242 -
 243
243 -
 244
244 -
 245
245 -
246
-
247
-
248
-
249
-
250
-
251
-
252
-
253
-
254
-
255
-
256
 |
 |

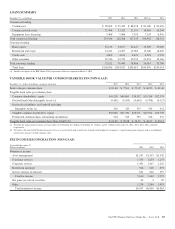
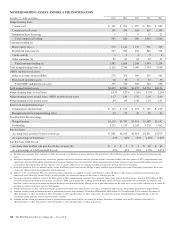
LOANS SUMMARY
December 31 – in millions 2015 2014 2013 2012 (a) 2011
Commercial lending
Commercial $ 98,608 $ 97,420 $ 88,378 $ 83,040 $ 65,694
Commercial real estate 27,468 23,262 21,191 18,655 16,204
Equipment lease financing 7,468 7,686 7,576 7,247 6,416
Total commercial lending 133,544 128,368 117,145 108,942 88,314
Consumer lending
Home equity 32,133 34,677 36,447 35,920 33,089
Residential real estate 14,411 14,407 15,065 15,240 14,469
Credit card 4,862 4,612 4,425 4,303 3,976
Other consumer 21,746 22,753 22,531 21,451 19,166
Total consumer lending 73,152 76,449 78,468 76,914 70,700
Total loans $206,696 $204,817 $195,613 $185,856 $159,014
(a) Includes the impact of the RBC Bank (USA) acquisition, which we acquired on March 2, 2012.
TANGIBLE BOOK VALUE PER COMMON SHARE RATIO (NON-GAAP)
December 31 – dollars in millions, except per share data 2015 2014 2013 2012 2011
Book value per common share $ 81.84 $ 77.61 $ 72.07 $ 66.95 $ 61.44
Tangible book value per common share
Common shareholders’ equity $41,258 $40,605 $38,392 $35,358 $32,374
Goodwill and Other Intangible Assets (a) (9,482) (9,595) (9,654) (9,798) (9,027)
Deferred tax liabilities on Goodwill and Other
Intangible Assets (a) 310 320 333 354 431
Tangible common shareholders’ equity $32,086 $31,330 $29,071 $25,914 $23,778
Period-end common shares outstanding (in millions) 504 523 533 528 527
Tangible book value per common share (Non-GAAP) (b) $ 63.65 $ 59.88 $ 54.57 $ 49.07 $ 45.13
(a) Excludes the impact from mortgage servicing rights of $1.6 billion, $1.4 billion, $1.6 billion, $1.1 billion, and $1.1 billion at December 31, 2015, 2014, 2013, 2012, and 2011,
respectively.
(b) We believe this non-GAAP financial measure serves as a useful tool to help evaluate the strength and discipline of a company’s capital management strategies and as an additional
conservative measure of total company value.
FEE INCOME RECONCILIATION (NON-GAAP)
Year ended December 31
Dollars in millions 2015 2014 2013
Noninterest income
Asset management $1,567 $1,513 $1,342
Consumer services 1,335 1,254 1,253
Corporate services 1,491 1,415 1,210
Residential mortgage 566 618 871
Service charges on deposits 651 662 597
Total fee income 5,610 5,462 5,273
Net gains on sales of securities 43 4 99
Other 1,294 1,384 1,493
Total noninterest income $6,947 $6,850 $6,865
The PNC Financial Services Group, Inc. – Form 10-K 217