PNC Bank 2015 Annual Report Download - page 179
Download and view the complete annual report
Please find page 179 of the 2015 PNC Bank annual report below. You can navigate through the pages in the report by either clicking on the pages listed below, or by using the keyword search tool below to find specific information within the annual report.-
 1
1 -
2
-
3
-
4
-
5
-
6
-
7
-
8
-
9
-
10
-
11
-
12
-
13
-
14
-
15
-
16
-
17
-
18
-
19
-
20
-
21
-
22
-
23
-
24
-
25
-
26
-
27
-
28
-
29
-
30
-
31
-
32
-
33
-
34
-
35
-
36
-
37
-
38
-
39
-
40
-
41
-
42
-
43
-
44
-
45
-
46
-
47
-
48
-
49
-
50
-
51
-
52
-
53
-
54
-
55
-
56
-
57
-
58
-
59
-
60
-
61
-
62
-
63
-
64
-
65
-
66
-
67
-
68
-
69
-
70
-
71
-
72
-
73
-
74
-
75
-
76
-
77
-
78
-
79
-
80
-
81
-
82
-
83
-
84
-
85
-
86
-
87
-
88
-
89
-
90
-
91
-
92
-
93
-
94
-
95
-
96
-
97
-
98
-
99
-
100
-
101
-
102
-
103
-
104
-
105
-
106
-
107
-
108
-
109
-
110
-
111
-
112
-
113
-
114
-
115
-
116
-
117
-
118
-
119
-
120
-
121
-
122
-
123
-
124
-
125
-
126
-
127
-
128
-
129
-
130
-
131
-
132
-
133
-
134
-
135
-
136
-
137
-
138
-
139
-
140
-
141
-
142
-
143
-
144
-
145
-
146
-
147
-
148
-
149
-
150
-
151
-
152
-
153
-
154
-
155
-
156
-
157
-
158
-
159
-
160
-
161
-
162
-
163
-
164
-
165
-
166
-
167
-
168
-
 169
169 -
 170
170 -
 171
171 -
 172
172 -
 173
173 -
 174
174 -
 175
175 -
 176
176 -
 177
177 -
 178
178 -
 179
179 -
 180
180 -
 181
181 -
 182
182 -
 183
183 -
 184
184 -
 185
185 -
 186
186 -
 187
187 -
 188
188 -
 189
189 -
190
-
191
-
192
-
193
-
194
-
195
-
196
-
197
-
198
-
199
-
200
-
201
-
202
-
203
-
204
-
205
-
206
-
207
-
208
-
209
-
210
-
211
-
212
-
213
-
214
-
215
-
216
-
217
-
218
-
219
-
220
-
221
-
222
-
223
-
224
-
225
-
226
-
227
-
228
-
229
-
230
-
231
-
232
-
233
-
234
-
235
-
236
-
237
-
238
-
239
-
240
-
241
-
242
-
243
-
244
-
245
-
246
-
247
-
248
-
249
-
250
-
251
-
252
-
253
-
254
-
255
-
256
 |
 |
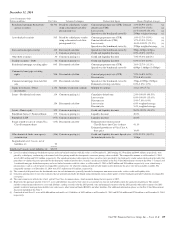
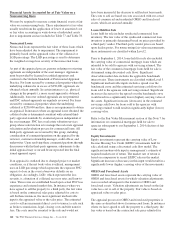
costs to sell. The significant unobservable inputs for OREO
and foreclosed assets are the appraised value or the sales price.
The estimated costs to sell are incremental direct costs to
transact a sale such as broker commissions, legal, closing
costs and title transfer fees. The costs must be essential to the
sale and would not have been incurred if the decision to sell
had not been made. The costs to sell are based on costs
associated with our sales of commercial and residential OREO
and foreclosed assets, which are assessed annually.
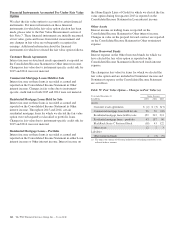
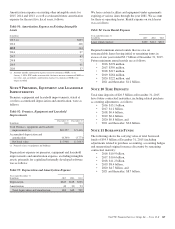
Long-Lived Assets Held for Sale
Long-lived assets held for sale represent the carrying value of
the asset for which valuation adjustments were recorded during
the current year and subsequent to the transfer to Long-lived
assets held for sale. Valuation adjustments are based on the fair
value of the property less an estimated cost to sell. Fair value is
determined either by a recent appraisal, recent sales offer or
changes in market or property conditions. Appraisals are
provided by licensed or certified appraisers. Where we have
agreed to sell the property to a third party, the fair value is
based on the contractual sale price. The significant
unobservable inputs for Long-lived assets held for sale are the
appraised value, the sales price or the changes in market or
property conditions. Changes in market or property conditions
are subjectively determined by management through
observation of the physical condition of the property along with
the condition of properties in the surrounding market place. The
availability and recent sales of similar properties is also
considered. The range of fair values can vary significantly as
this category often includes smaller properties such as offsite
ATM locations and smaller rural branches up to large
commercial buildings, operation centers or urban branches.
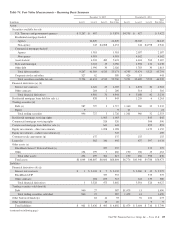
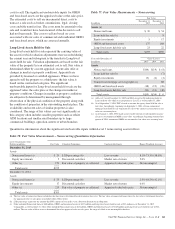
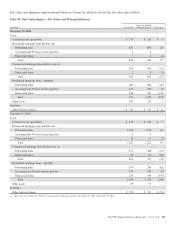
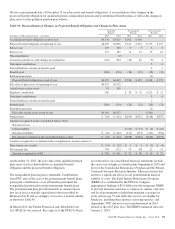
Table 77: Fair Value Measurements – Nonrecurring
Fair Value
In millions
December 31
2015
December 31
2014
Assets (a)
Nonaccrual loans $ 30 $ 54
Loans held for sale (b) 8
Equity investments 5 17
OREO and foreclosed assets 137 168
Long-lived assets held for sale 23 22
Total assets $195 $269
Year ended December 31 Gains (Losses)
In millions 2015 2014 2013
Assets
Nonaccrual loans $(44) $(19) $ (8)
Loans held for sale (b) (7)
Equity investments (3) (2) (1)
Commercial mortgage servicing rights (c) 88
OREO and foreclosed assets (18) (19) (26)
Long-lived assets held for sale (20) (14) (40)
Total assets $(85) $(54) $ 6
(a) All Level 3 as of December 31, 2015 and 2014 except for $8 million included in
Loans held for sale which was categorized as Level 2 as of December 31, 2014.
(b) As of September 1, 2014, PNC elected to account for agency loans held for sale at
fair value. Accordingly, beginning on September 1, 2014, all new commercial
mortgage loans held for sale originated for sale to the agencies are measured at fair
value on a recurring basis.
(c) As of January 1, 2014, PNC made an irrevocable election to subsequently measure
all classes of commercial MSRs at fair value. Accordingly, beginning with the first
quarter of 2014, commercial MSRs are measured at fair value on a recurring basis.
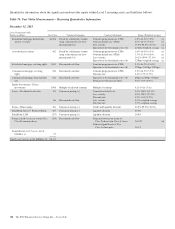
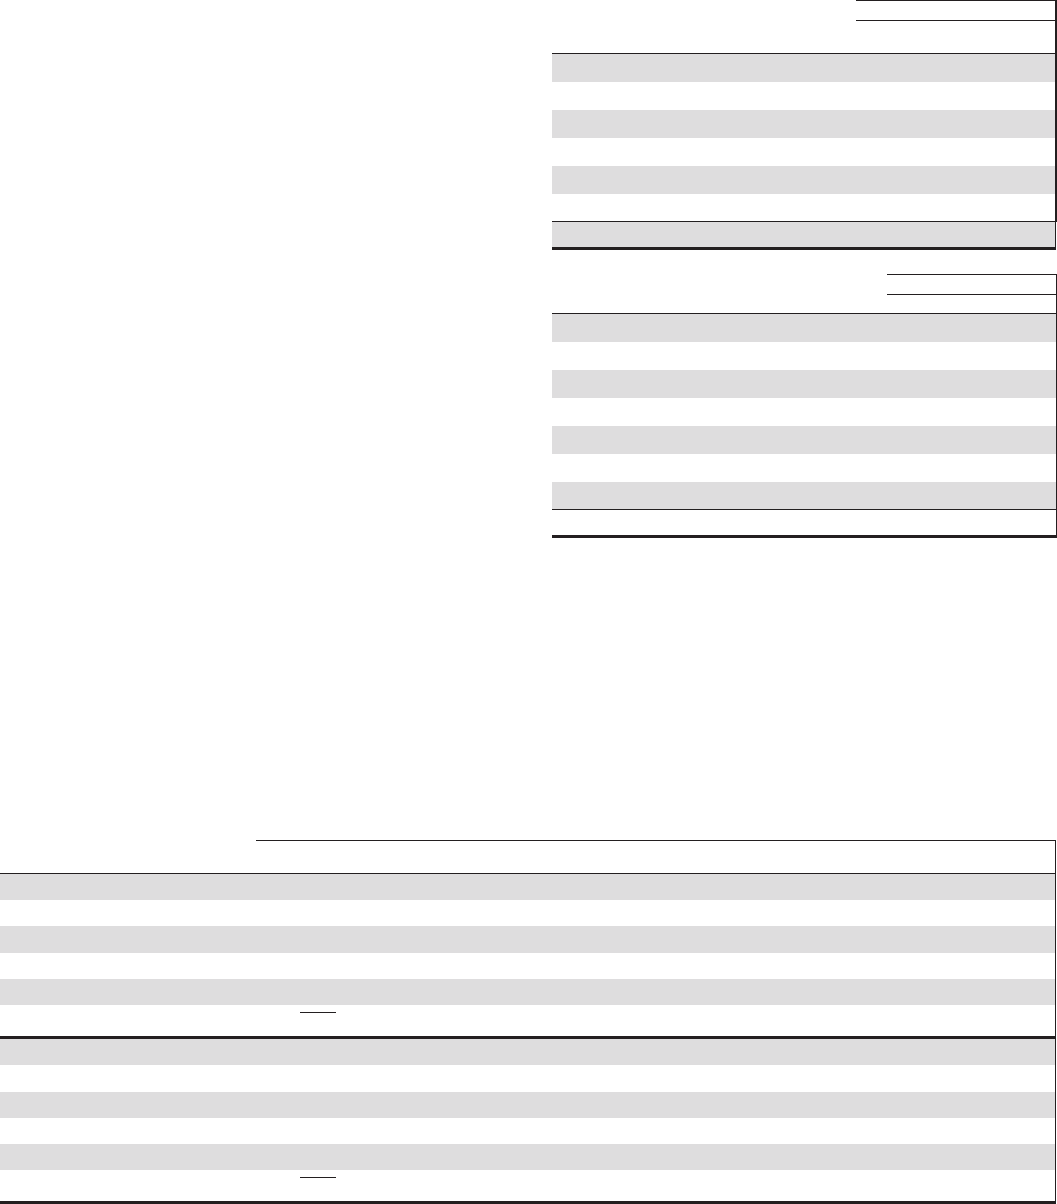
Quantitative information about the significant unobservable inputs within Level 3 nonrecurring assets follows.
Table 78: Fair Value Measurements – Nonrecurring Quantitative Information
Level 3 Instruments Only
Dollars in millions Fair Value Valuation Techniques Unobservable Inputs Range (Weighted Average)
December 31, 2015
Assets
Nonaccrual loans (a) $ 20 LGD percentage (b) Loss severity 8.1%-73.3% (58.6%)
Equity investments 5 Discounted cash flow Market rate of return 5.0%
Other (c) 170 Fair value of property or collateral Appraised value/sales price Not meaningful
Total assets $195
December 31, 2014
Assets
Nonaccrual loans (a) $ 29 LGD percentage (b) Loss severity 2.9%-68.5% (42.1%)
Equity investments 17 Discounted cash flow Market rate of return 6.0%
Other (c) 215 Fair value of property or collateral Appraised value/sales price Not meaningful
Total assets $261
(a) The fair value of nonaccrual loans included in this line item is determined based on internal loss rates. The fair value of nonaccrual loans where the fair value is determined based on
the appraised value or sales price is included within Other, below.
(b) LGD percentage represents the amount that PNC expects to lose in the event a borrower defaults on an obligation.
(c) Other included Nonaccrual loans of $10 million, OREO and foreclosed assets of $137 million and Long-lived assets held for sale of $23 million as of December 31, 2015.
Comparably, as of December 31, 2014, Other included Nonaccrual loans of $25 million, OREO and foreclosed assets of $168 million and Long-lived assets held for sale of $22
million. The fair value of these assets is determined based on appraised value or sales price, the range of which is not meaningful to disclose.
The PNC Financial Services Group, Inc. – Form 10-K 161