PNC Bank 2015 Annual Report Download - page 108
Download and view the complete annual report
Please find page 108 of the 2015 PNC Bank annual report below. You can navigate through the pages in the report by either clicking on the pages listed below, or by using the keyword search tool below to find specific information within the annual report.-
 1
1 -
2
-
3
-
4
-
5
-
6
-
7
-
8
-
9
-
10
-
11
-
12
-
13
-
14
-
15
-
16
-
17
-
18
-
19
-
20
-
21
-
22
-
23
-
24
-
25
-
26
-
27
-
28
-
29
-
30
-
31
-
32
-
33
-
34
-
35
-
36
-
37
-
38
-
39
-
40
-
41
-
42
-
43
-
44
-
45
-
46
-
47
-
48
-
49
-
50
-
51
-
52
-
53
-
54
-
55
-
56
-
57
-
58
-
59
-
60
-
61
-
62
-
63
-
64
-
65
-
66
-
67
-
68
-
69
-
70
-
71
-
72
-
73
-
74
-
75
-
76
-
77
-
78
-
79
-
80
-
81
-
82
-
83
-
84
-
85
-
86
-
87
-
88
-
89
-
90
-
91
-
92
-
93
-
94
-
95
-
96
-
97
-
 98
98 -
 99
99 -
 100
100 -
 101
101 -
 102
102 -
 103
103 -
 104
104 -
 105
105 -
 106
106 -
 107
107 -
 108
108 -
 109
109 -
 110
110 -
 111
111 -
 112
112 -
 113
113 -
 114
114 -
 115
115 -
 116
116 -
 117
117 -
 118
118 -
119
-
120
-
121
-
122
-
123
-
124
-
125
-
126
-
127
-
128
-
129
-
130
-
131
-
132
-
133
-
134
-
135
-
136
-
137
-
138
-
139
-
140
-
141
-
142
-
143
-
144
-
145
-
146
-
147
-
148
-
149
-
150
-
151
-
152
-
153
-
154
-
155
-
156
-
157
-
158
-
159
-
160
-
161
-
162
-
163
-
164
-
165
-
166
-
167
-
168
-
169
-
170
-
171
-
172
-
173
-
174
-
175
-
176
-
177
-
178
-
179
-
180
-
181
-
182
-
183
-
184
-
185
-
186
-
187
-
188
-
189
-
190
-
191
-
192
-
193
-
194
-
195
-
196
-
197
-
198
-
199
-
200
-
201
-
202
-
203
-
204
-
205
-
206
-
207
-
208
-
209
-
210
-
211
-
212
-
213
-
214
-
215
-
216
-
217
-
218
-
219
-
220
-
221
-
222
-
223
-
224
-
225
-
226
-
227
-
228
-
229
-
230
-
231
-
232
-
233
-
234
-
235
-
236
-
237
-
238
-
239
-
240
-
241
-
242
-
243
-
244
-
245
-
246
-
247
-
248
-
249
-
250
-
251
-
252
-
253
-
254
-
255
-
256
 |
 |

an institution rated single-A by the credit rating agencies.
Given the illiquid nature of many of these types of
investments, it can be a challenge to determine their fair
values. See Note 7 Fair Value in the Notes To Consolidated
Financial Statements in Item 8 of this Report for additional
information.
Various PNC business units manage our equity and other
investment activities. Our businesses are responsible for
making investment decisions within the approved policy limits
and associated guidelines.
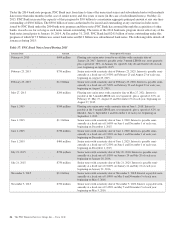
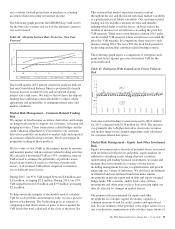
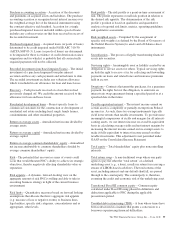
A summary of our equity investments follows:
Table 48: Equity Investments Summary
In millions
December 31
2015
December 31
2014
BlackRock $ 6,626 $ 6,265
Tax credit investments 2,254 2,616
Private equity 1,441 1,615
Visa 31 77
Other 235 155
Total $10,587 $10,728
BlackRock
PNC owned approximately 35 million common stock
equivalent shares of BlackRock equity at December 31, 2015,
accounted for under the equity method. The primary risk
measurement, similar to other equity investments, is economic
capital. The Business Segments Review section of this Item 7
includes additional information about BlackRock.
Tax Credit Investments
Included in our equity investments are direct tax credit
investments and equity investments held by consolidated
partnerships which totaled $2.3 billion at December 31, 2015
and $2.6 billion at December 31, 2014. These equity
investment balances include unfunded commitments totaling
$669 million and $717 million at December 31, 2015 and
December 31, 2014, respectively. These unfunded
commitments are included in Other Liabilities on our
Consolidated Balance Sheet.
Note 2 Loan Sale and Servicing Activities and Variable
Interest Entities in the Notes To Consolidated Financial
Statements in Item 8 of this Report has further information on
Tax Credit Investments.
Private Equity
The private equity portfolio is an illiquid portfolio comprised
of mezzanine and equity investments that vary by industry,
stage and type of investment.
Private equity investments carried at estimated fair value
totaled $1.4 billion at December 31, 2015 and $1.6 billion at
December 31, 2014. As of December 31, 2015, $1.1 billion
was invested directly in a variety of companies and $.3 billion
was invested indirectly through various private equity funds.
Included in direct investments are investment activities of two
private equity funds that are consolidated for financial
reporting purposes. The noncontrolling interests of these funds
totaled $170 million as of December 31, 2015. The interests
held in indirect private equity funds are not redeemable, but
PNC may receive distributions over the life of the partnership
from liquidation of the underlying investments. See Item 1
Business – Supervision and Regulation and Item 1A Risk
Factors of this Report for discussion of the potential impacts
of the Volcker Rule provisions of Dodd-Frank on our interests
in and of private funds covered by the Volcker Rule.
In 2015, PNC invested with six other banks in Early Warning
Services (EWS), a provider of fraud prevention and risk
management solutions. EWS then acquired ClearXchange, a
network through which customers send and receive person-to-
person payments. Integrating these businesses will enable us
to, among other things, create a secure, real-time payments
network.
Our unfunded commitments related to private equity totaled
$126 million at December 31, 2015 compared with $140
million at December 31, 2014.
Visa
See Note 7 Fair Value, Note 20 Legal Proceedings and Note
21 Commitments and Guarantees in the Notes To
Consolidated Financial Statements in Item 8 of this Report for
additional information regarding the October 2007 Visa
restructuring, our involvement with judgment and loss sharing
agreements with Visa and certain other banks, the status of
pending interchange litigation, the sales of portions of our
Visa Class B common shares and the related swap agreements
with the purchasers.
During 2015, we sold 2.0 million Visa Class B common
shares, in addition to the 16.5 million shares sold in previous
years. We have entered into swap agreements with the
purchasers of the shares as part of these sales. See Note 7 Fair
Value in the Notes To Consolidated Financial Statements in
Item 8 of this Report for additional information. At
December 31, 2015, our investment in Visa Class B common
shares totaled approximately 4.9 million shares and had a
carrying value of $31 million. Based on the December 31,
2015 closing price of $77.55 for the Visa Class A common
shares, the fair value of our total investment was
approximately $622 million at the current conversion rate. The
Visa Class B common shares that we own are transferable
only under limited circumstances until they can be converted
into shares of the publicly traded class of stock, which cannot
happen until the settlement of all of the specified litigation.
90 The PNC Financial Services Group, Inc. – Form 10-K