PNC Bank 2015 Annual Report Download - page 201
Download and view the complete annual report
Please find page 201 of the 2015 PNC Bank annual report below. You can navigate through the pages in the report by either clicking on the pages listed below, or by using the keyword search tool below to find specific information within the annual report.-
 1
1 -
2
-
3
-
4
-
5
-
6
-
7
-
8
-
9
-
10
-
11
-
12
-
13
-
14
-
15
-
16
-
17
-
18
-
19
-
20
-
21
-
22
-
23
-
24
-
25
-
26
-
27
-
28
-
29
-
30
-
31
-
32
-
33
-
34
-
35
-
36
-
37
-
38
-
39
-
40
-
41
-
42
-
43
-
44
-
45
-
46
-
47
-
48
-
49
-
50
-
51
-
52
-
53
-
54
-
55
-
56
-
57
-
58
-
59
-
60
-
61
-
62
-
63
-
64
-
65
-
66
-
67
-
68
-
69
-
70
-
71
-
72
-
73
-
74
-
75
-
76
-
77
-
78
-
79
-
80
-
81
-
82
-
83
-
84
-
85
-
86
-
87
-
88
-
89
-
90
-
91
-
92
-
93
-
94
-
95
-
96
-
97
-
98
-
99
-
100
-
101
-
102
-
103
-
104
-
105
-
106
-
107
-
108
-
109
-
110
-
111
-
112
-
113
-
114
-
115
-
116
-
117
-
118
-
119
-
120
-
121
-
122
-
123
-
124
-
125
-
126
-
127
-
128
-
129
-
130
-
131
-
132
-
133
-
134
-
135
-
136
-
137
-
138
-
139
-
140
-
141
-
142
-
143
-
144
-
145
-
146
-
147
-
148
-
149
-
150
-
151
-
152
-
153
-
154
-
155
-
156
-
157
-
158
-
159
-
160
-
161
-
162
-
163
-
164
-
165
-
166
-
167
-
168
-
169
-
170
-
171
-
172
-
173
-
174
-
175
-
176
-
177
-
178
-
179
-
180
-
181
-
182
-
183
-
184
-
185
-
186
-
187
-
188
-
189
-
190
-
 191
191 -
 192
192 -
 193
193 -
 194
194 -
 195
195 -
 196
196 -
 197
197 -
 198
198 -
 199
199 -
 200
200 -
 201
201 -
 202
202 -
 203
203 -
 204
204 -
 205
205 -
 206
206 -
 207
207 -
 208
208 -
 209
209 -
 210
210 -
 211
211 -
212
-
213
-
214
-
215
-
216
-
217
-
218
-
219
-
220
-
221
-
222
-
223
-
224
-
225
-
226
-
227
-
228
-
229
-
230
-
231
-
232
-
233
-
234
-
235
-
236
-
237
-
238
-
239
-
240
-
241
-
242
-
243
-
244
-
245
-
246
-
247
-
248
-
249
-
250
-
251
-
252
-
253
-
254
-
255
-
256
 |
 |

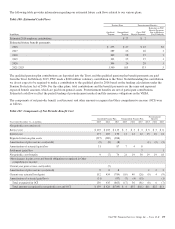
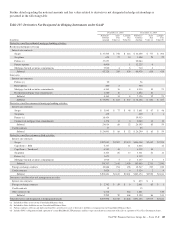
Further detail regarding the notional amounts and fair values related to derivatives not designated in hedge relationships is
presented in the following table:
Table 115: Derivatives Not Designated As Hedging Instruments under GAAP
December 31, 2015 December 31, 2014
In millions
Notional /
Contract
Amount
Asset
Fair
Value (a)
Liability
Fair
Value (b)
Notional /
Contract
Amount
Asset
Fair
Value (a)
Liability
Fair
Value (b)
Derivatives used for residential mortgage banking activities:
Residential mortgage servicing
Interest rate contracts:
Swaps $ 37,505 $ 758 $ 416 $ 32,459 $ 777 $ 394
Swaptions 650 27 14 1,498 29 22
Futures (c) 17,653 22,084
Futures options 6,000 1 12,225 4
Mortgage-backed securities commitments 3,920 4 8 710 4
Subtotal 65,728 789 439 68,976 814 416
Loan sales
Interest rate contracts:
Futures (c) 20 58
Bond options 200 2 300
Mortgage-backed securities commitments 6,363 16 8 4,916 10 21
Residential mortgage loan commitments 1,580 16 1,852 22
Subtotal 8,163 34 8 7,126 32 21
Subtotal $ 73,891 $ 823 $ 447 $ 76,102 $ 846 $ 437
Derivatives used for commercial mortgage banking activities:
Interest rate contracts:
Swaps $ 3,945 $ 77 $ 46 $ 3,801 $ 67 $ 48
Swaptions 439 439 2 1
Futures (c) 18,454 19,913
Commercial mortgage loan commitments 1,176 11 6 2,042 16 10
Subtotal 24,014 88 52 26,195 85 59
Credit contracts 77 95
Subtotal $ 24,091 $ 88 $ 52 $ 26,290 $ 85 $ 59
Derivatives used for customer-related activities:
Interest rate contracts:
Swaps $157,041 $2,507 $2,433 $146,008 $2,632 $2,559
Caps/floors – Sold 5,337 11 4,846 16
Caps/floors – Purchased 6,383 18 6,339 34
Swaptions 4,363 86 13 3,361 62 12
Futures (c) 1,673 3,112
Mortgage-backed securities commitments 1,910 5 2 2,137 3 3
Subtotal 176,707 2,616 2,459 165,803 2,731 2,590
Foreign exchange contracts 10,888 194 198 12,547 223 240
Credit contracts 5,026 2 4 5,124 2 4
Subtotal $192,621 $2,812 $2,661 $183,474 $2,956 $2,834
Derivatives used for other risk management activities:
Interest rate contracts $ 833 $ 1
Foreign exchange contracts $ 2,742 $ 59 $ 6 2,661 85 $ 1
Credit contracts 15 15
Other contracts (d) 2,542 462 1,881 510
Subtotal 5,299 59 468 5,390 86 511
Total derivatives not designated as hedging instruments $295,902 $3,782 $3,628 $291,256 $3,973 $3,841
(a) Included in Other assets on our Consolidated Balance Sheet.
(b) Included in Other liabilities on our Consolidated Balance Sheet.
(c) Futures contracts settle in cash daily and, therefore, no derivative asset or derivative liability is recognized on our Consolidated Balance Sheet.
(d) Includes PNC’s obligation to fund a portion of certain BlackRock LTIP programs and the swaps entered into in connection with sales of a portion of Visa Class B common shares.
The PNC Financial Services Group, Inc. – Form 10-K 183