PNC Bank 2015 Annual Report Download - page 164
Download and view the complete annual report
Please find page 164 of the 2015 PNC Bank annual report below. You can navigate through the pages in the report by either clicking on the pages listed below, or by using the keyword search tool below to find specific information within the annual report.-
 1
1 -
2
-
3
-
4
-
5
-
6
-
7
-
8
-
9
-
10
-
11
-
12
-
13
-
14
-
15
-
16
-
17
-
18
-
19
-
20
-
21
-
22
-
23
-
24
-
25
-
26
-
27
-
28
-
29
-
30
-
31
-
32
-
33
-
34
-
35
-
36
-
37
-
38
-
39
-
40
-
41
-
42
-
43
-
44
-
45
-
46
-
47
-
48
-
49
-
50
-
51
-
52
-
53
-
54
-
55
-
56
-
57
-
58
-
59
-
60
-
61
-
62
-
63
-
64
-
65
-
66
-
67
-
68
-
69
-
70
-
71
-
72
-
73
-
74
-
75
-
76
-
77
-
78
-
79
-
80
-
81
-
82
-
83
-
84
-
85
-
86
-
87
-
88
-
89
-
90
-
91
-
92
-
93
-
94
-
95
-
96
-
97
-
98
-
99
-
100
-
101
-
102
-
103
-
104
-
105
-
106
-
107
-
108
-
109
-
110
-
111
-
112
-
113
-
114
-
115
-
116
-
117
-
118
-
119
-
120
-
121
-
122
-
123
-
124
-
125
-
126
-
127
-
128
-
129
-
130
-
131
-
132
-
133
-
134
-
135
-
136
-
137
-
138
-
139
-
140
-
141
-
142
-
143
-
144
-
145
-
146
-
147
-
148
-
149
-
150
-
151
-
152
-
153
-
 154
154 -
 155
155 -
 156
156 -
 157
157 -
 158
158 -
 159
159 -
 160
160 -
 161
161 -
 162
162 -
 163
163 -
 164
164 -
 165
165 -
 166
166 -
 167
167 -
 168
168 -
 169
169 -
 170
170 -
 171
171 -
 172
172 -
 173
173 -
 174
174 -
175
-
176
-
177
-
178
-
179
-
180
-
181
-
182
-
183
-
184
-
185
-
186
-
187
-
188
-
189
-
190
-
191
-
192
-
193
-
194
-
195
-
196
-
197
-
198
-
199
-
200
-
201
-
202
-
203
-
204
-
205
-
206
-
207
-
208
-
209
-
210
-
211
-
212
-
213
-
214
-
215
-
216
-
217
-
218
-
219
-
220
-
221
-
222
-
223
-
224
-
225
-
226
-
227
-
228
-
229
-
230
-
231
-
232
-
233
-
234
-
235
-
236
-
237
-
238
-
239
-
240
-
241
-
242
-
243
-
244
-
245
-
246
-
247
-
248
-
249
-
250
-
251
-
252
-
253
-
254
-
255
-
256
 |
 |

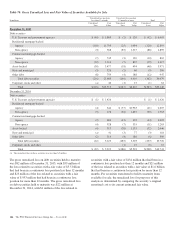
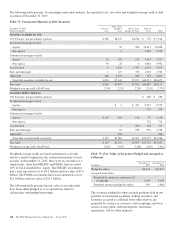
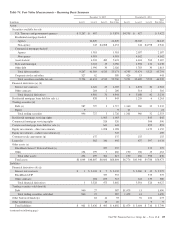
Table 70: Gross Unrealized Loss and Fair Value of Securities Available for Sale
In millions
Unrealized loss position
less than 12 months
Unrealized loss position
12 months or more Total
Unrealized
Loss
Fair
Value
Unrealized
Loss
Fair
Value
Unrealized
Loss
Fair
Value
December 31, 2015
Debt securities
U.S. Treasury and government agencies $ (40) $ 5,885 $ (2) $ 120 $ (42) $ 6,005
Residential mortgage-backed
Agency (103) 11,799 (25) 1,094 (128) 12,893
Non-agency (3) 368 (85) 1,527 (88) 1,895
Commercial mortgage-backed
Agency (7) 745 (3) 120 (10) 865
Non-agency (22) 2,310 (7) 807 (29) 3,117
Asset-backed (30) 3,477 (18) 494 (48) 3,971
State and municipal (3) 326 (2) 60 (5) 386
Other debt (8) 759 (4) 188 (12) 947
Total debt securities (216) 25,669 (146) 4,410 (362) 30,079
Corporate stocks and other (a) 46 (1) 15 (1) 61
Total $(216) $25,715 $(147) $4,425 $(363) $30,140
December 31, 2014
Debt securities
U.S. Treasury and government agencies $ (1) $ 1,426 $ (1) $ 1,426
Residential mortgage-backed
Agency (4) 644 $ (37) $1,963 (41) 2,607
Non-agency (5) 276 (94) 1,487 (99) 1,763
Commercial mortgage-backed
Agency (2) 681 (12) 322 (14) 1,003
Non-agency (4) 928 (7) 335 (11) 1,263
Asset-backed (4) 913 (28) 1,133 (32) 2,046
State and municipal (a) 41 (3) 77 (3) 118
Other debt (2) 314 (4) 186 (6) 500
Total debt securities (22) 5,223 (185) 5,503 (207) 10,726
Corporate stocks and other (1) 15 (1) 15
Total $ (22) $ 5,223 $(186) $5,518 $(208) $10,741
(a) The unrealized loss on these securities was less than $.5 million.
The gross unrealized loss on debt securities held to maturity
was $82 million at December 31, 2015, with $59 million of
the loss related to securities with a fair value of $5.5 billion
that had been in a continuous loss position less than 12 months
and $23 million of the loss related to securities with a fair
value of $ 953 million that had been in a continuous loss
position for more than 12 months. The gross unrealized loss
on debt securities held to maturity was $22 million at
December 31, 2014, with $1 million of the loss related to
securities with a fair value of $134 million that had been in a
continuous loss position less than 12 months and $21 million
of the loss related to securities with a fair value of $1.6 billion
that had been in a continuous loss position for more than 12
months. For securities transferred to held to maturity from
available for sale, the unrealized loss for purposes of this
analysis is determined by comparing the security’s original
amortized cost to its current estimated fair value.
146 The PNC Financial Services Group, Inc. – Form 10-K