PNC Bank 2015 Annual Report Download - page 205
Download and view the complete annual report
Please find page 205 of the 2015 PNC Bank annual report below. You can navigate through the pages in the report by either clicking on the pages listed below, or by using the keyword search tool below to find specific information within the annual report.-
 1
1 -
2
-
3
-
4
-
5
-
6
-
7
-
8
-
9
-
10
-
11
-
12
-
13
-
14
-
15
-
16
-
17
-
18
-
19
-
20
-
21
-
22
-
23
-
24
-
25
-
26
-
27
-
28
-
29
-
30
-
31
-
32
-
33
-
34
-
35
-
36
-
37
-
38
-
39
-
40
-
41
-
42
-
43
-
44
-
45
-
46
-
47
-
48
-
49
-
50
-
51
-
52
-
53
-
54
-
55
-
56
-
57
-
58
-
59
-
60
-
61
-
62
-
63
-
64
-
65
-
66
-
67
-
68
-
69
-
70
-
71
-
72
-
73
-
74
-
75
-
76
-
77
-
78
-
79
-
80
-
81
-
82
-
83
-
84
-
85
-
86
-
87
-
88
-
89
-
90
-
91
-
92
-
93
-
94
-
95
-
96
-
97
-
98
-
99
-
100
-
101
-
102
-
103
-
104
-
105
-
106
-
107
-
108
-
109
-
110
-
111
-
112
-
113
-
114
-
115
-
116
-
117
-
118
-
119
-
120
-
121
-
122
-
123
-
124
-
125
-
126
-
127
-
128
-
129
-
130
-
131
-
132
-
133
-
134
-
135
-
136
-
137
-
138
-
139
-
140
-
141
-
142
-
143
-
144
-
145
-
146
-
147
-
148
-
149
-
150
-
151
-
152
-
153
-
154
-
155
-
156
-
157
-
158
-
159
-
160
-
161
-
162
-
163
-
164
-
165
-
166
-
167
-
168
-
169
-
170
-
171
-
172
-
173
-
174
-
175
-
176
-
177
-
178
-
179
-
180
-
181
-
182
-
183
-
184
-
185
-
186
-
187
-
188
-
189
-
190
-
191
-
192
-
193
-
194
-
 195
195 -
 196
196 -
 197
197 -
 198
198 -
 199
199 -
 200
200 -
 201
201 -
 202
202 -
 203
203 -
 204
204 -
 205
205 -
 206
206 -
 207
207 -
 208
208 -
 209
209 -
 210
210 -
 211
211 -
 212
212 -
 213
213 -
 214
214 -
 215
215 -
216
-
217
-
218
-
219
-
220
-
221
-
222
-
223
-
224
-
225
-
226
-
227
-
228
-
229
-
230
-
231
-
232
-
233
-
234
-
235
-
236
-
237
-
238
-
239
-
240
-
241
-
242
-
243
-
244
-
245
-
246
-
247
-
248
-
249
-
250
-
251
-
252
-
253
-
254
-
255
-
256
 |
 |
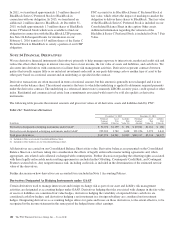
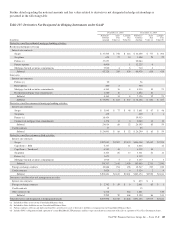
The table above includes over-the-counter (OTC) derivatives,
cleared derivatives, and exchange-traded derivatives. OTC
derivatives represent contracts executed bilaterally with
counterparties that are not settled through an organized
exchange or cleared through a central clearing house. Cleared
derivatives represent contracts executed bilaterally with
counterparties in the OTC market that are novated to a central
clearing house who then becomes our counterparty. Exchange-
traded derivatives represent standardized futures and options
contracts executed directly on an organized exchange.
As of December 31, 2015, derivative fair values and related
cash collateral for derivatives cleared through a central
clearing house are, when appropriate, presented on a net basis.
The derivative fair values in the table not identified as cleared
or exchange-traded represent OTC derivatives, the majority of
which are governed by ISDA documentation or other legally
enforceable industry standard master netting agreements and
are subject to offsetting.
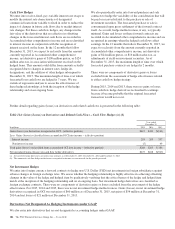
In addition to using master netting agreements and other
collateral agreements to reduce credit risk associated with
derivative instruments, we also seek to manage credit risk by
evaluating credit ratings of counterparties and by using
internal credit analysis, limits, and monitoring procedures.
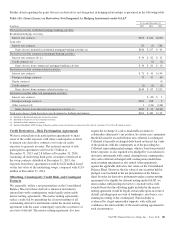
At December 31, 2015, we held cash, U.S. government
securities and mortgage-backed securities totaling $.9 billion
under master netting agreements and other collateral
agreements to collateralize net derivative assets due from
counterparties, and we pledged cash totaling $.9 billion under
these agreements to collateralize net derivative liabilities owed
to counterparties and to meet initial margin requirements.
These totals may differ from the amounts presented in the
preceding offsetting table because these totals may include
collateral exchanged under an agreement that does not qualify
as a master netting agreement or because the total amount of
collateral held or pledged exceeds the net derivative fair
values with the counterparty as of the balance sheet date due
to timing or other factors, such as initial margin. To the extent
not netted against the derivative fair values under a master
netting agreement, the receivable for cash pledged is included
in Other assets and the obligation for cash held is included in
Other borrowed funds on our Consolidated Balance Sheet.
Securities held from counterparties are not recognized on our
balance sheet. Likewise securities we have pledged to
counterparties remain on our balance sheet.
Certain derivative agreements contain various credit-risk
related contingent provisions, such as those that require PNC’s
debt to maintain a specified credit rating from one or more of
the major credit rating agencies. If PNC’s debt ratings were to
fall below such specified ratings, the counterparties to the
derivative instruments could request immediate payment or
demand immediate and ongoing full collateralization on
derivative instruments in net liability positions. The aggregate
fair value of all derivative instruments with credit-risk-related
contingent features that were in a net liability position on
December 31, 2015 was $.8 billion for which PNC had posted
collateral of $.6 billion in the normal course of business. The
maximum additional amount of collateral PNC would have
been required to post if the credit-risk-related contingent
features underlying these agreements had been triggered on
December 31, 2015 would be $.2 billion.
The PNC Financial Services Group, Inc. – Form 10-K 187