PNC Bank 2015 Annual Report Download - page 162
Download and view the complete annual report
Please find page 162 of the 2015 PNC Bank annual report below. You can navigate through the pages in the report by either clicking on the pages listed below, or by using the keyword search tool below to find specific information within the annual report.-
 1
1 -
2
-
3
-
4
-
5
-
6
-
7
-
8
-
9
-
10
-
11
-
12
-
13
-
14
-
15
-
16
-
17
-
18
-
19
-
20
-
21
-
22
-
23
-
24
-
25
-
26
-
27
-
28
-
29
-
30
-
31
-
32
-
33
-
34
-
35
-
36
-
37
-
38
-
39
-
40
-
41
-
42
-
43
-
44
-
45
-
46
-
47
-
48
-
49
-
50
-
51
-
52
-
53
-
54
-
55
-
56
-
57
-
58
-
59
-
60
-
61
-
62
-
63
-
64
-
65
-
66
-
67
-
68
-
69
-
70
-
71
-
72
-
73
-
74
-
75
-
76
-
77
-
78
-
79
-
80
-
81
-
82
-
83
-
84
-
85
-
86
-
87
-
88
-
89
-
90
-
91
-
92
-
93
-
94
-
95
-
96
-
97
-
98
-
99
-
100
-
101
-
102
-
103
-
104
-
105
-
106
-
107
-
108
-
109
-
110
-
111
-
112
-
113
-
114
-
115
-
116
-
117
-
118
-
119
-
120
-
121
-
122
-
123
-
124
-
125
-
126
-
127
-
128
-
129
-
130
-
131
-
132
-
133
-
134
-
135
-
136
-
137
-
138
-
139
-
140
-
141
-
142
-
143
-
144
-
145
-
146
-
147
-
148
-
149
-
150
-
151
-
 152
152 -
 153
153 -
 154
154 -
 155
155 -
 156
156 -
 157
157 -
 158
158 -
 159
159 -
 160
160 -
 161
161 -
 162
162 -
 163
163 -
 164
164 -
 165
165 -
 166
166 -
 167
167 -
 168
168 -
 169
169 -
 170
170 -
 171
171 -
 172
172 -
173
-
174
-
175
-
176
-
177
-
178
-
179
-
180
-
181
-
182
-
183
-
184
-
185
-
186
-
187
-
188
-
189
-
190
-
191
-
192
-
193
-
194
-
195
-
196
-
197
-
198
-
199
-
200
-
201
-
202
-
203
-
204
-
205
-
206
-
207
-
208
-
209
-
210
-
211
-
212
-
213
-
214
-
215
-
216
-
217
-
218
-
219
-
220
-
221
-
222
-
223
-
224
-
225
-
226
-
227
-
228
-
229
-
230
-
231
-
232
-
233
-
234
-
235
-
236
-
237
-
238
-
239
-
240
-
241
-
242
-
243
-
244
-
245
-
246
-
247
-
248
-
249
-
250
-
251
-
252
-
253
-
254
-
255
-
256
 |
 |

N
OTE
6I
NVESTMENT
S
ECURITIES
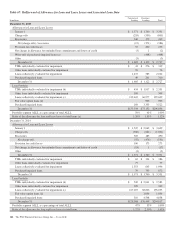
Table 69: Investment Securities Summary
Amortized
Cost
Unrealized Fair
ValueIn millions Gains Losses
December 31, 2015
S
ECURITIES
A
VAILABLE FOR
S
ALE
Debt securities
U.S. Treasury and government agencies $ 9,764 $ 152 $ (42) $ 9,874
Residential mortgage-backed
Agency 24,698 250 (128) 24,820
Non-agency 3,992 247 (88) 4,151
Commercial mortgage-backed
Agency 1,917 11 (10) 1,918
Non-agency 4,902 30 (29) 4,903
Asset-backed 5,417 54 (48) 5,423
State and municipal 1,982 79 (5) 2,056
Other debt 2,007 31 (12) 2,026
Total debt securities 54,679 854 (362) 55,171
Corporate stocks and other 590 (1) 589
Total securities available for sale $55,269 $ 854 $(363) $55,760
S
ECURITIES
H
ELD TO
M
ATURITY
(a)
Debt securities
U.S. Treasury and government agencies $ 258 $ 40 $ 298
Residential mortgage-backed
Agency 9,552 101 $ (65) 9,588
Non-agency 233 8 241
Commercial mortgage-backed
Agency 1,128 40 1,168
Non-agency 722 6 (1) 727
Asset-backed 717 (10) 707
State and municipal 1,954 116 2,070
Other debt 204 (1) 203
Total securities held to maturity $14,768 $ 311 $ (77) $15,002
December 31, 2014
S
ECURITIES
A
VAILABLE FOR
S
ALE
Debt securities
U.S. Treasury and government agencies $ 5,237 $ 186 $ (1) $ 5,422
Residential mortgage-backed
Agency 17,646 438 (41) 18,043
Non-agency 4,723 318 (99) 4,942
Commercial mortgage-backed
Agency 2,178 23 (14) 2,187
Non-agency 4,085 88 (11) 4,162
Asset-backed 5,141 78 (32) 5,187
State and municipal 1,953 88 (3) 2,038
Other debt 1,776 43 (6) 1,813
Total debt securities 42,739 1,262 (207) 43,794
Corporate stocks and other 442 (1) 441
Total securities available for sale $43,181 $1,262 $(208) $44,235
S
ECURITIES
H
ELD TO
M
ATURITY
(a)
Debt securities
U.S. Treasury and government agencies $ 248 $ 44 $ 292
Residential mortgage-backed
Agency 5,736 166 $ (10) 5,892
Non-agency 270 13 283
144 The PNC Financial Services Group, Inc. – Form 10-K