PNC Bank 2015 Annual Report Download - page 182
Download and view the complete annual report
Please find page 182 of the 2015 PNC Bank annual report below. You can navigate through the pages in the report by either clicking on the pages listed below, or by using the keyword search tool below to find specific information within the annual report.-
 1
1 -
2
-
3
-
4
-
5
-
6
-
7
-
8
-
9
-
10
-
11
-
12
-
13
-
14
-
15
-
16
-
17
-
18
-
19
-
20
-
21
-
22
-
23
-
24
-
25
-
26
-
27
-
28
-
29
-
30
-
31
-
32
-
33
-
34
-
35
-
36
-
37
-
38
-
39
-
40
-
41
-
42
-
43
-
44
-
45
-
46
-
47
-
48
-
49
-
50
-
51
-
52
-
53
-
54
-
55
-
56
-
57
-
58
-
59
-
60
-
61
-
62
-
63
-
64
-
65
-
66
-
67
-
68
-
69
-
70
-
71
-
72
-
73
-
74
-
75
-
76
-
77
-
78
-
79
-
80
-
81
-
82
-
83
-
84
-
85
-
86
-
87
-
88
-
89
-
90
-
91
-
92
-
93
-
94
-
95
-
96
-
97
-
98
-
99
-
100
-
101
-
102
-
103
-
104
-
105
-
106
-
107
-
108
-
109
-
110
-
111
-
112
-
113
-
114
-
115
-
116
-
117
-
118
-
119
-
120
-
121
-
122
-
123
-
124
-
125
-
126
-
127
-
128
-
129
-
130
-
131
-
132
-
133
-
134
-
135
-
136
-
137
-
138
-
139
-
140
-
141
-
142
-
143
-
144
-
145
-
146
-
147
-
148
-
149
-
150
-
151
-
152
-
153
-
154
-
155
-
156
-
157
-
158
-
159
-
160
-
161
-
162
-
163
-
164
-
165
-
166
-
167
-
168
-
169
-
170
-
171
-
 172
172 -
 173
173 -
 174
174 -
 175
175 -
 176
176 -
 177
177 -
 178
178 -
 179
179 -
 180
180 -
 181
181 -
 182
182 -
 183
183 -
 184
184 -
 185
185 -
 186
186 -
 187
187 -
 188
188 -
 189
189 -
 190
190 -
 191
191 -
 192
192 -
193
-
194
-
195
-
196
-
197
-
198
-
199
-
200
-
201
-
202
-
203
-
204
-
205
-
206
-
207
-
208
-
209
-
210
-
211
-
212
-
213
-
214
-
215
-
216
-
217
-
218
-
219
-
220
-
221
-
222
-
223
-
224
-
225
-
226
-
227
-
228
-
229
-
230
-
231
-
232
-
233
-
234
-
235
-
236
-
237
-
238
-
239
-
240
-
241
-
242
-
243
-
244
-
245
-
246
-
247
-
248
-
249
-
250
-
251
-
252
-
253
-
254
-
255
-
256
 |
 |

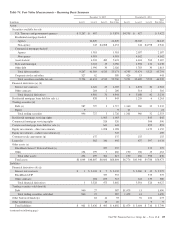
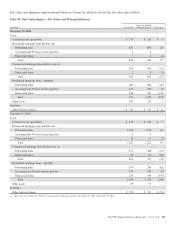
Additional Fair Value Information Related to Other Financial Instruments
The following table presents the carrying amounts and estimated fair values, including the level within the fair value hierarchy, of
all other financial instruments that are not measured on the consolidated financial statements at fair value as of December 31, 2015
and December 31, 2014.
Table 81: Additional Fair Value Information Related to Other Financial Instruments
In millions
Carrying
Amount
Fair Value
Total Level 1 Level 2 Level 3
December 31, 2015
Assets
Cash and due from banks $ 4,065 $ 4,065 $4,065
Short-term assets 32,959 32,959 $ 32,959
Securities held to maturity 14,768 15,002 298 14,698 $ 6
Loans held for sale 56 56 22 34
Net loans (excludes leases) 195,579 197,611 197,611
Other assets 1,817 2,408 1,786 622 (a)
Total assets $249,244 $252,101 $4,363 $ 49,465 $198,273
Liabilities
Demand, savings and money market deposits $228,492 $228,492 $228,492
Time deposits 20,510 20,471 20,471
Borrowed funds 53,761 54,002 52,578 $ 1,424
Unfunded loan commitments and letters of credit 245 245 245
Total liabilities $303,008 $303,210 $301,541 $ 1,669
December 31, 2014
Assets
Cash and due from banks $ 4,360 $ 4,360 $4,360
Short-term assets 34,380 34,380 $ 34,380
Securities held to maturity 11,588 11,984 292 11,683 $ 9
Loans held for sale 108 108 56 52
Net loans (excludes leases) 192,573 194,564 194,564
Other assets 1,879 2,544 1,802 742 (a)
Total assets $244,888 $247,940 $4,652 $ 47,921 $195,367
Liabilities
Demand, savings and money market deposits $210,838 $210,838 $210,838
Time deposits 21,396 21,392 21,392
Borrowed funds 55,329 56,011 54,574 $ 1,437
Unfunded loan commitments and letters of credit 240 240 240
Total liabilities $287,803 $288,481 $286,804 $ 1,677
(a) Represents estimated fair value of Visa Class B common shares, which was estimated solely based upon the December 31, 2015 and December 31, 2014 closing price for the Visa
Class A common shares, respectively, and the Visa Class B common share conversion rate, which reflects adjustments in respect of all litigation funding by Visa as of that date. The
transfer restrictions on the Visa Class B common shares could impact the aforementioned estimate, until they can be converted to Class A common shares. See Note 21 Commitments
and Guarantees for additional information.
164 The PNC Financial Services Group, Inc. – Form 10-K