PNC Bank 2015 Annual Report Download - page 82
Download and view the complete annual report
Please find page 82 of the 2015 PNC Bank annual report below. You can navigate through the pages in the report by either clicking on the pages listed below, or by using the keyword search tool below to find specific information within the annual report.-
 1
1 -
2
-
3
-
4
-
5
-
6
-
7
-
8
-
9
-
10
-
11
-
12
-
13
-
14
-
15
-
16
-
17
-
18
-
19
-
20
-
21
-
22
-
23
-
24
-
25
-
26
-
27
-
28
-
29
-
30
-
31
-
32
-
33
-
34
-
35
-
36
-
37
-
38
-
39
-
40
-
41
-
42
-
43
-
44
-
45
-
46
-
47
-
48
-
49
-
50
-
51
-
52
-
53
-
54
-
55
-
56
-
57
-
58
-
59
-
60
-
61
-
62
-
63
-
64
-
65
-
66
-
67
-
68
-
69
-
70
-
71
-
 72
72 -
 73
73 -
 74
74 -
 75
75 -
 76
76 -
 77
77 -
 78
78 -
 79
79 -
 80
80 -
 81
81 -
 82
82 -
 83
83 -
 84
84 -
 85
85 -
 86
86 -
 87
87 -
 88
88 -
 89
89 -
 90
90 -
 91
91 -
 92
92 -
93
-
94
-
95
-
96
-
97
-
98
-
99
-
100
-
101
-
102
-
103
-
104
-
105
-
106
-
107
-
108
-
109
-
110
-
111
-
112
-
113
-
114
-
115
-
116
-
117
-
118
-
119
-
120
-
121
-
122
-
123
-
124
-
125
-
126
-
127
-
128
-
129
-
130
-
131
-
132
-
133
-
134
-
135
-
136
-
137
-
138
-
139
-
140
-
141
-
142
-
143
-
144
-
145
-
146
-
147
-
148
-
149
-
150
-
151
-
152
-
153
-
154
-
155
-
156
-
157
-
158
-
159
-
160
-
161
-
162
-
163
-
164
-
165
-
166
-
167
-
168
-
169
-
170
-
171
-
172
-
173
-
174
-
175
-
176
-
177
-
178
-
179
-
180
-
181
-
182
-
183
-
184
-
185
-
186
-
187
-
188
-
189
-
190
-
191
-
192
-
193
-
194
-
195
-
196
-
197
-
198
-
199
-
200
-
201
-
202
-
203
-
204
-
205
-
206
-
207
-
208
-
209
-
210
-
211
-
212
-
213
-
214
-
215
-
216
-
217
-
218
-
219
-
220
-
221
-
222
-
223
-
224
-
225
-
226
-
227
-
228
-
229
-
230
-
231
-
232
-
233
-
234
-
235
-
236
-
237
-
238
-
239
-
240
-
241
-
242
-
243
-
244
-
245
-
246
-
247
-
248
-
249
-
250
-
251
-
252
-
253
-
254
-
255
-
256
 |
 |

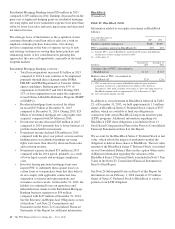
For reporting units with goodwill, when determining the
reporting unit’s fair value and comparing it to its carrying
value, we generally utilize the highest of these three amounts
(the “targeted equity”) in our discounted cash flow
methodology. Under this methodology, if necessary, we will
infuse capital to achieve the targeted equity amount. As of
October 1, 2015 (annual impairment testing date), unallocated
excess capital (difference between shareholders’ equity minus
total economic capital assigned and increased by the
incremental targeted equity net capital infusion) represented
capital reserved for potential future capital needs.
The results of our annual 2015 impairment test indicated that
the estimated fair values of our reporting units with goodwill
exceeded their carrying values by at least 10% and are not
considered to be at risk of not passing Step 1. By definition,
assumptions utilized in estimating the fair value of a reporting
unit are judgmental and inherently uncertain, but absent a
significant change in economic conditions of a reporting unit,
we would not expect the fair values of these reporting units to
decrease below their respective carrying values. Similarly,
there were no impairment charges related to goodwill in 2014
or 2013.
See Note 8 Goodwill and Intangible Assets in the Notes To
Consolidated Financial Statements in Item 8 of this Report for
additional information.
Lease Residuals
We provide financing for various types of equipment,
including aircraft, energy and power systems, and vehicles
through a variety of lease arrangements. Direct financing
leases are carried at the sum of lease payments and the
estimated residual value of the leased property, less unearned
income. Residual values are subject to judgments as to the
value of the underlying equipment that can be affected by
changes in economic and market conditions and the financial
viability of the residual guarantors. Residual values are
derived from historical remarketing experience, secondary
market contacts, and industry publications. To the extent not
guaranteed or assumed by a third-party, we bear the risk of
ownership of the leased assets. This includes the risk that the
actual value of the leased assets at the end of the lease term
will be less than the estimated residual value, which could
result in an impairment charge and reduce earnings in the
future. Residual values are reviewed for impairment at least
annually.
Revenue Recognition
We earn net interest and noninterest income from various
sources, including:
• Lending,
• Securities portfolio,
• Asset management,
• Customer deposits,
• Loan sales and servicing,
• Brokerage services,
• Sale of loans and securities,
• Certain private equity activities, and
• Securities, derivatives and foreign exchange
activities.
We also earn fees and commissions from issuing loan
commitments, standby letters of credit and financial
guarantees, selling various insurance products, providing
treasury management services, providing merger and
acquisition advisory and related services, and participating in
certain capital markets transactions. Revenue earned on
interest-earning assets, including the accretion of discounts
recognized on acquired or purchased loans recorded at fair
value, is recognized based on the constant effective yield of
the financial instrument or based on other applicable
accounting guidance.
The timing and amount of revenue that we recognize in any
period is dependent on estimates, judgments, assumptions, and
interpretation of contractual terms. Changes in these factors
can have a significant impact on revenue recognized in any
period due to changes in products, market conditions or
industry norms.
Residential And Commercial Mortgage Servicing
Rights
We elect to measure our residential and commercial mortgage
servicing rights (MSRs) at fair value. This election was made
to be consistent with our risk management strategy to hedge
changes in the fair value of these assets. The fair value of
residential and commercial MSRs is estimated by using a cash
flow valuation model which calculates the present value of
estimated future net servicing cash flows, taking into
consideration actual and expected mortgage loan prepayment
rates, discount rates, servicing costs, and other economic
factors which are determined based on current market
conditions. Prior to 2014, commercial MSRs were initially
recorded at fair value and subsequently accounted for at the
lower of amortized cost or fair value. Commercial MSRs were
periodically evaluated for impairment.
PNC employs risk management strategies designed to protect
the value of MSRs from changes in interest rates and related
market factors. The values of the residential and commercial
MSRs are economically hedged with securities and
derivatives, including interest-rate swaps, options, and
forward mortgage-backed and futures contracts. As interest
rates change, these financial instruments are expected to have
changes in fair value negatively correlated to the change in
fair value of the hedged MSR portfolios. The hedge
relationships are actively managed in response to changing
market conditions over the life of the MSRs. Selecting
appropriate financial instruments to economically hedge
residential or commercial MSRs requires significant
64 The PNC Financial Services Group, Inc. – Form 10-K