PNC Bank 2015 Annual Report Download - page 166
Download and view the complete annual report
Please find page 166 of the 2015 PNC Bank annual report below. You can navigate through the pages in the report by either clicking on the pages listed below, or by using the keyword search tool below to find specific information within the annual report.-
 1
1 -
2
-
3
-
4
-
5
-
6
-
7
-
8
-
9
-
10
-
11
-
12
-
13
-
14
-
15
-
16
-
17
-
18
-
19
-
20
-
21
-
22
-
23
-
24
-
25
-
26
-
27
-
28
-
29
-
30
-
31
-
32
-
33
-
34
-
35
-
36
-
37
-
38
-
39
-
40
-
41
-
42
-
43
-
44
-
45
-
46
-
47
-
48
-
49
-
50
-
51
-
52
-
53
-
54
-
55
-
56
-
57
-
58
-
59
-
60
-
61
-
62
-
63
-
64
-
65
-
66
-
67
-
68
-
69
-
70
-
71
-
72
-
73
-
74
-
75
-
76
-
77
-
78
-
79
-
80
-
81
-
82
-
83
-
84
-
85
-
86
-
87
-
88
-
89
-
90
-
91
-
92
-
93
-
94
-
95
-
96
-
97
-
98
-
99
-
100
-
101
-
102
-
103
-
104
-
105
-
106
-
107
-
108
-
109
-
110
-
111
-
112
-
113
-
114
-
115
-
116
-
117
-
118
-
119
-
120
-
121
-
122
-
123
-
124
-
125
-
126
-
127
-
128
-
129
-
130
-
131
-
132
-
133
-
134
-
135
-
136
-
137
-
138
-
139
-
140
-
141
-
142
-
143
-
144
-
145
-
146
-
147
-
148
-
149
-
150
-
151
-
152
-
153
-
154
-
155
-
 156
156 -
 157
157 -
 158
158 -
 159
159 -
 160
160 -
 161
161 -
 162
162 -
 163
163 -
 164
164 -
 165
165 -
 166
166 -
 167
167 -
 168
168 -
 169
169 -
 170
170 -
 171
171 -
 172
172 -
 173
173 -
 174
174 -
 175
175 -
 176
176 -
177
-
178
-
179
-
180
-
181
-
182
-
183
-
184
-
185
-
186
-
187
-
188
-
189
-
190
-
191
-
192
-
193
-
194
-
195
-
196
-
197
-
198
-
199
-
200
-
201
-
202
-
203
-
204
-
205
-
206
-
207
-
208
-
209
-
210
-
211
-
212
-
213
-
214
-
215
-
216
-
217
-
218
-
219
-
220
-
221
-
222
-
223
-
224
-
225
-
226
-
227
-
228
-
229
-
230
-
231
-
232
-
233
-
234
-
235
-
236
-
237
-
238
-
239
-
240
-
241
-
242
-
243
-
244
-
245
-
246
-
247
-
248
-
249
-
250
-
251
-
252
-
253
-
254
-
255
-
256
 |
 |

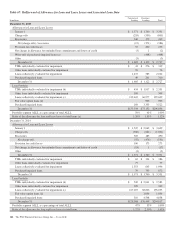
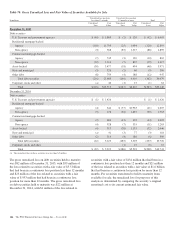
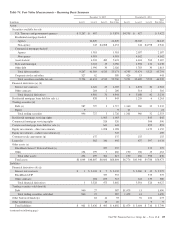
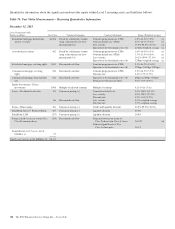
The following table presents, by remaining contractual maturity, the amortized cost, fair value and weighted-average yield of debt
securities at December 31, 2015.
Table 72: Contractual Maturity of Debt Securities
December 31, 2015
Dollars in millions
1 Year or
Less
After 1 Year
through 5
Years
After 5 Years
through 10 Years
After 10
Years Total
Securities Available for Sale
U.S. Treasury and government agencies $ 586 $4,172 $4,234 $ 772 $ 9,764
Residential mortgage-backed
Agency 99 986 23,613 24,698
Non-agency 3 3,989 3,992
Commercial mortgage-backed
Agency 22 109 232 1,554 1,917
Non-agency 50 28 8 4,816 4,902
Asset-backed 9 1,526 1,787 2,095 5,417
State and municipal 1 127 336 1,518 1,982
Other debt 186 1,377 289 155 2,007
Total debt securities available for sale $ 854 $7,441 $7,872 $38,512 $54,679
Fair value $ 861 $7,497 $7,926 $38,887 $55,171
Weighted-average yield, GAAP basis 2.76% 2.23% 2.28% 2.91% 2.73%
Securities Held to Maturity
U.S. Treasury and government agencies $ 258 $ 258
Residential mortgage-backed
Agency $ 4 $ 321 9,227 9,552
Non-agency 233 233
Commercial mortgage-backed
Agency $ 119 810 142 57 1,128
Non-agency 722 722
Asset-backed 3 590 124 717
State and municipal 62 938 954 1,954
Other debt 204 204
Total debt securities held to maturity $ 119 $1,083 $1,991 $11,575 $14,768
Fair value $ 119 $1,112 $2,059 $11,712 $15,002
Weighted-average yield, GAAP basis 3.02% 3.41% 3.18% 3.46% 3.42%
Weighted-average yields are based on historical cost with
effective yields weighted for the contractual maturity of each
security. At December 31, 2015, there were no securities of a
single issuer, other than FHLMC and FNMA, that exceeded
10% of Total shareholders’ equity. The FHLMC investments
had a total amortized cost of $4.9 billion and fair value of $5.0
billion. The FNMA investments had a total amortized cost of
$21.0 billion and fair value of $21.1 billion.
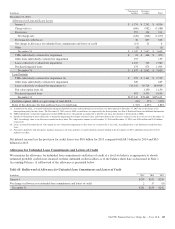
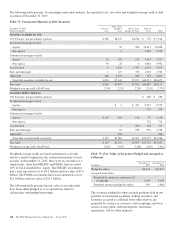
The following table presents the fair value of securities that
have been either pledged to or accepted from others to
collateralize outstanding borrowings.
Table 73: Fair Value of Securities Pledged and Accepted as
Collateral
In millions
December 31
2015
December 31
2014
Pledged to others $9,674 $10,874
Accepted from others:
Permitted by contract or custom to sell
or repledge 1,100 1,658
Permitted amount repledged to others 943 1,488
The securities pledged to others include positions held in our
portfolio of investment securities, trading securities, and
securities accepted as collateral from others that we are
permitted by contract or custom to sell or repledge, and were
used to secure public and trust deposits, repurchase
agreements, and for other purposes.
148 The PNC Financial Services Group, Inc. – Form 10-K