PNC Bank 2015 Annual Report Download - page 95
Download and view the complete annual report
Please find page 95 of the 2015 PNC Bank annual report below. You can navigate through the pages in the report by either clicking on the pages listed below, or by using the keyword search tool below to find specific information within the annual report.-
 1
1 -
2
-
3
-
4
-
5
-
6
-
7
-
8
-
9
-
10
-
11
-
12
-
13
-
14
-
15
-
16
-
17
-
18
-
19
-
20
-
21
-
22
-
23
-
24
-
25
-
26
-
27
-
28
-
29
-
30
-
31
-
32
-
33
-
34
-
35
-
36
-
37
-
38
-
39
-
40
-
41
-
42
-
43
-
44
-
45
-
46
-
47
-
48
-
49
-
50
-
51
-
52
-
53
-
54
-
55
-
56
-
57
-
58
-
59
-
60
-
61
-
62
-
63
-
64
-
65
-
66
-
67
-
68
-
69
-
70
-
71
-
72
-
73
-
74
-
75
-
76
-
77
-
78
-
79
-
80
-
81
-
82
-
83
-
84
-
 85
85 -
 86
86 -
 87
87 -
 88
88 -
 89
89 -
 90
90 -
 91
91 -
 92
92 -
 93
93 -
 94
94 -
 95
95 -
 96
96 -
 97
97 -
 98
98 -
 99
99 -
 100
100 -
 101
101 -
 102
102 -
 103
103 -
 104
104 -
 105
105 -
106
-
107
-
108
-
109
-
110
-
111
-
112
-
113
-
114
-
115
-
116
-
117
-
118
-
119
-
120
-
121
-
122
-
123
-
124
-
125
-
126
-
127
-
128
-
129
-
130
-
131
-
132
-
133
-
134
-
135
-
136
-
137
-
138
-
139
-
140
-
141
-
142
-
143
-
144
-
145
-
146
-
147
-
148
-
149
-
150
-
151
-
152
-
153
-
154
-
155
-
156
-
157
-
158
-
159
-
160
-
161
-
162
-
163
-
164
-
165
-
166
-
167
-
168
-
169
-
170
-
171
-
172
-
173
-
174
-
175
-
176
-
177
-
178
-
179
-
180
-
181
-
182
-
183
-
184
-
185
-
186
-
187
-
188
-
189
-
190
-
191
-
192
-
193
-
194
-
195
-
196
-
197
-
198
-
199
-
200
-
201
-
202
-
203
-
204
-
205
-
206
-
207
-
208
-
209
-
210
-
211
-
212
-
213
-
214
-
215
-
216
-
217
-
218
-
219
-
220
-
221
-
222
-
223
-
224
-
225
-
226
-
227
-
228
-
229
-
230
-
231
-
232
-
233
-
234
-
235
-
236
-
237
-
238
-
239
-
240
-
241
-
242
-
243
-
244
-
245
-
246
-
247
-
248
-
249
-
250
-
251
-
252
-
253
-
254
-
255
-
256
 |
 |

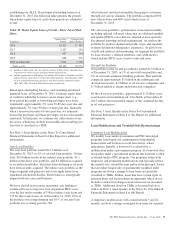
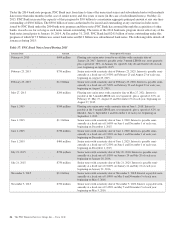
Troubled Debt Restructurings
A TDR is a loan whose terms have been restructured in a
manner that grants a concession to a borrower experiencing
financial difficulties. TDRs result from our loss mitigation
activities and include rate reductions, principal forgiveness,
postponement/reduction of scheduled amortization and
extensions, which are intended to minimize economic loss and
to avoid foreclosure or repossession of collateral.
Additionally, TDRs also result from borrowers that have been
discharged from personal liability through Chapter 7
bankruptcy and have not formally reaffirmed their loan
obligations to PNC.
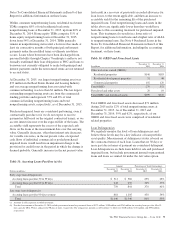
Table 34: Summary of Troubled Debt Restructurings (a)
In millions
December 31
2015
December 31
2014
Consumer lending:
Real estate-related $1,775 $1,864
Credit card 108 130
Other consumer 34 47
Total consumer lending (b) 1,917 2,041
Total commercial lending 434 542
Total TDRs $2,351 $2,583
Nonperforming $1,119 $1,370
Accruing 1,232 1,213
Total TDRs $2,351 $2,583
(a) Amounts in table represent recorded investment, which includes the unpaid principal
balance plus accrued interest and net accounting adjustments, less any charge-offs.
Recorded investment does not include any associated valuation allowance.
(b) Excludes $1.2 billion and $.9 billion of consumer loans held for sale, loans
accounted for under the fair value option and pooled purchased impaired loans, as
well as certain government insured or guaranteed loans at December 31, 2015 and
December 31, 2014, respectively.
Total TDRs decreased $232 million, or 9%, during 2015.
Nonperforming TDRs were approximately 53% of total
nonperforming loans, and 48% of total TDRs.
TDRs that are performing, including credit card loans, are
excluded from nonperforming loans. These TDRs remained
generally flat during 2015 at $1.2 billion. Generally, the
accruing category is comprised of loans where borrowers have
been performing under the restructured terms for at least six
consecutive months. Loans where borrowers have been
discharged from personal liability through Chapter 7
bankruptcy and have not formally reaffirmed their loan
obligations to PNC and loans to borrowers not currently
obligated to make both principal and interest payments under
the restructured terms are not returned to accrual status.
See Note 3 Asset Quality in the Notes To Consolidated
Financial Statements in Item 8 of this Report for additional
information on loan modifications and TDRs.
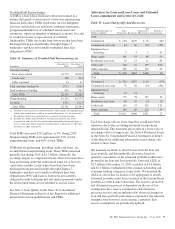
Allowances for Loan and Lease Losses and Unfunded
Loan Commitments and Letters of Credit
Table 35: Loan Charge-Offs And Recoveries
Year ended December 31
Dollars in millions
Gross
Charge-offs Recoveries
Net
Charge-offs /
(Recoveries)
Percent of
Average Loans
2015
Commercial $ 206 $170 $ 36 .04%
Commercial real estate 44 66 (22) (.09)
Equipment lease
financing 5 4 1 .01
Home equity 181 93 88 .26
Residential real estate 24 13 11 .08
Credit card 160 21 139 3.06
Other consumer 185 52 133 .60
Total $ 805 $419 $386 .19
2014
Commercial $ 276 $207 $ 69 .07%
Commercial real estate 70 84 (14) (.06)
Equipment lease
financing 14 14
Home equity 275 78 197 .56
Residential real estate 40 26 14 .10
Credit card 163 21 142 3.24
Other consumer 183 60 123 .54
Total $1,021 $490 $531 .27
Total net charge-offs are lower than they would have been
otherwise due to the accounting treatment for purchased
impaired loans. This treatment also results in a lower ratio of
net charge-offs to average loans. See Note 4 Purchased Loans
in the Notes To Consolidated Financial Statements in Item 8
of this Report for additional information on net charge-offs
related to these loans.
We maintain an ALLL to absorb losses from the loan and
lease portfolio and determine this allowance based on
quarterly assessments of the estimated probable credit losses
incurred in the loan and lease portfolio. Our total ALLL of
$2.7 billion at December 31, 2015 consisted of $1.6 billion
and $1.1 billion established for the commercial lending and
consumer lending categories, respectively. We maintain the
ALLL at a level that we believe to be appropriate to absorb
estimated probable credit losses incurred in the loan and lease
portfolio as of the balance sheet date. The reserve calculation
and determination process is dependent on the use of key
assumptions. Key reserve assumptions and estimation
processes react to and are influenced by observed changes in
loan and lease portfolio performance experience, the financial
strength of the borrower, and economic conditions. Key
reserve assumptions are periodically updated.
The PNC Financial Services Group, Inc. – Form 10-K 77