PNC Bank 2015 Annual Report Download - page 79
Download and view the complete annual report
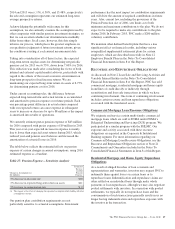
Please find page 79 of the 2015 PNC Bank annual report below. You can navigate through the pages in the report by either clicking on the pages listed below, or by using the keyword search tool below to find specific information within the annual report.-
 1
1 -
2
-
3
-
4
-
5
-
6
-
7
-
8
-
9
-
10
-
11
-
12
-
13
-
14
-
15
-
16
-
17
-
18
-
19
-
20
-
21
-
22
-
23
-
24
-
25
-
26
-
27
-
28
-
29
-
30
-
31
-
32
-
33
-
34
-
35
-
36
-
37
-
38
-
39
-
40
-
41
-
42
-
43
-
44
-
45
-
46
-
47
-
48
-
49
-
50
-
51
-
52
-
53
-
54
-
55
-
56
-
57
-
58
-
59
-
60
-
61
-
62
-
63
-
64
-
65
-
66
-
67
-
68
-
 69
69 -
 70
70 -
 71
71 -
 72
72 -
 73
73 -
 74
74 -
 75
75 -
 76
76 -
 77
77 -
 78
78 -
 79
79 -
 80
80 -
 81
81 -
 82
82 -
 83
83 -
 84
84 -
 85
85 -
 86
86 -
 87
87 -
 88
88 -
 89
89 -
90
-
91
-
92
-
93
-
94
-
95
-
96
-
97
-
98
-
99
-
100
-
101
-
102
-
103
-
104
-
105
-
106
-
107
-
108
-
109
-
110
-
111
-
112
-
113
-
114
-
115
-
116
-
117
-
118
-
119
-
120
-
121
-
122
-
123
-
124
-
125
-
126
-
127
-
128
-
129
-
130
-
131
-
132
-
133
-
134
-
135
-
136
-
137
-
138
-
139
-
140
-
141
-
142
-
143
-
144
-
145
-
146
-
147
-
148
-
149
-
150
-
151
-
152
-
153
-
154
-
155
-
156
-
157
-
158
-
159
-
160
-
161
-
162
-
163
-
164
-
165
-
166
-
167
-
168
-
169
-
170
-
171
-
172
-
173
-
174
-
175
-
176
-
177
-
178
-
179
-
180
-
181
-
182
-
183
-
184
-
185
-
186
-
187
-
188
-
189
-
190
-
191
-
192
-
193
-
194
-
195
-
196
-
197
-
198
-
199
-
200
-
201
-
202
-
203
-
204
-
205
-
206
-
207
-
208
-
209
-
210
-
211
-
212
-
213
-
214
-
215
-
216
-
217
-
218
-
219
-
220
-
221
-
222
-
223
-
224
-
225
-
226
-
227
-
228
-
229
-
230
-
231
-
232
-
233
-
234
-
235
-
236
-
237
-
238
-
239
-
240
-
241
-
242
-
243
-
244
-
245
-
246
-
247
-
248
-
249
-
250
-
251
-
252
-
253
-
254
-
255
-
256
 |
 |

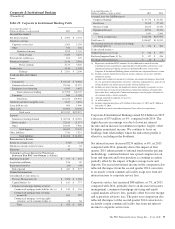
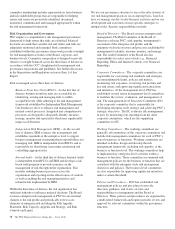
Non-Strategic Assets Portfolio
(Unaudited)
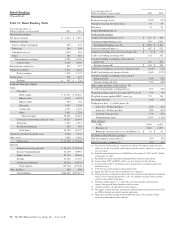
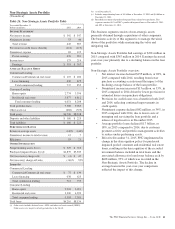
Table 26: Non-Strategic Assets Portfolio Table
Year ended December 31
Dollars in millions 2015 2014
I
NCOME
S
TATEMENT
Net interest income $ 392 $ 547
Noninterest income 53 40
Total revenue 445 587
Provision for credit losses (benefit) (114) (119)
Noninterest expense 83 125
Pretax earnings 476 581
Income taxes 175 214
Earnings $ 301 $ 367
A
VERAGE
B
ALANCE
S
HEET
Commercial Lending
Commercial/Commercial real estate $ 107 $ 180
Lease financing 630 675
Total commercial lending 737 855
Consumer Lending
Home equity 2,774 3,396
Residential real estate 3,877 4,812
Total consumer lending 6,651 8,208
Total portfolio loans 7,388 9,063
Other assets (a) (682) (725)
Total assets $6,706 $8,338
Deposits and other liabilities $ 186 $ 225
Total liabilities $ 186 $ 225
P
ERFORMANCE
R
ATIOS
Return on average assets 4.49% 4.40%
Noninterest income to total revenue 12 7
Efficiency 19 21
O
THER
I
NFORMATION
Nonperforming assets (b) (c) $ 529 $ 710
Purchased impaired loans (b) (d) $2,839 $3,943
Net (recoveries) charge-offs $ (4) $ 47
Net (recovery) charge-off ratio (.06)% .52%
Loans (b)
Commercial Lending
Commercial/Commercial real estate $ 75 $ 130
Lease financing 638 625
Total commercial lending 713 755
Consumer Lending
Home equity 2,203 3,091
Residential real estate 3,300 4,290
Total consumer lending 5,503 7,381
Total loans $6,216 $8,136
(a) Other assets includes deferred taxes, ALLL and other real estate owned (OREO).
Other assets were negative in both periods due to the ALLL.
(b) As of December 31.
(c) Includes nonperforming loans of $.4 billion at December 31, 2015 and $.6 billion at
December 31, 2014.
(d) Recorded investment of purchased impaired loans related to acquisitions. This
segment contained 81% of PNC’s purchased impaired loans at December 31, 2015
and 80% at December 31, 2014.
This business segment consists of non-strategic assets
primarily obtained through acquisitions of other companies.
The business activity of this segment is to manage the wind-
down of the portfolios while maximizing the value and
mitigating risk.
Non-Strategic Assets Portfolio had earnings of $301 million in
2015 compared with $367 million in 2014. Earnings decreased
year-over-year primarily due to a declining balance in the loan
portfolio.
Non-Strategic Assets Portfolio overview:
• Net interest income declined $155 million, or 28%, in
2015 compared with 2014, resulting from lower
purchase accounting accretion and the impact of the
declining average balance of the loan portfolio.
• Noninterest income increased $13 million, or 33%, in
2015 compared to 2014 driven by lower provision for
estimated losses on repurchase obligations.
• Provision for credit losses was a benefit in both 2015
and 2014, reflecting continued improvements in
credit quality.
• Noninterest expense declined $42 million, or 34%, in
2015 compared with 2014, due to lower costs of
managing and servicing the loan portfolio and a
release of legal reserves in December 2015.
• Average portfolio loans declined $1.7 billion, or
18%, in 2015 compared to 2014, due to customer
payment activity and portfolio management activities
to reduce under-performing assets.
• Effective December 31, 2015, PNC implemented its
change in the derecognition policy for purchased
impaired pooled consumer and residential real estate
loans, resulting in the derecognition of the recorded
investment balance included in total loans and the
associated allowance for loan losses balance each by
$468 million, 93% of which was recorded in the
Non-Strategic Assets Portfolio. The decline in
average loans in the year-over-year comparison
reflected the impact of this change.
The PNC Financial Services Group, Inc. – Form 10-K 61