PNC Bank 2015 Annual Report Download - page 54
Download and view the complete annual report
Please find page 54 of the 2015 PNC Bank annual report below. You can navigate through the pages in the report by either clicking on the pages listed below, or by using the keyword search tool below to find specific information within the annual report.-
 1
1 -
2
-
3
-
4
-
5
-
6
-
7
-
8
-
9
-
10
-
11
-
12
-
13
-
14
-
15
-
16
-
17
-
18
-
19
-
20
-
21
-
22
-
23
-
24
-
25
-
26
-
27
-
28
-
29
-
30
-
31
-
32
-
33
-
34
-
35
-
36
-
37
-
38
-
39
-
40
-
41
-
42
-
43
-
 44
44 -
 45
45 -
 46
46 -
 47
47 -
 48
48 -
 49
49 -
 50
50 -
 51
51 -
 52
52 -
 53
53 -
 54
54 -
 55
55 -
 56
56 -
 57
57 -
 58
58 -
 59
59 -
 60
60 -
 61
61 -
 62
62 -
 63
63 -
 64
64 -
65
-
66
-
67
-
68
-
69
-
70
-
71
-
72
-
73
-
74
-
75
-
76
-
77
-
78
-
79
-
80
-
81
-
82
-
83
-
84
-
85
-
86
-
87
-
88
-
89
-
90
-
91
-
92
-
93
-
94
-
95
-
96
-
97
-
98
-
99
-
100
-
101
-
102
-
103
-
104
-
105
-
106
-
107
-
108
-
109
-
110
-
111
-
112
-
113
-
114
-
115
-
116
-
117
-
118
-
119
-
120
-
121
-
122
-
123
-
124
-
125
-
126
-
127
-
128
-
129
-
130
-
131
-
132
-
133
-
134
-
135
-
136
-
137
-
138
-
139
-
140
-
141
-
142
-
143
-
144
-
145
-
146
-
147
-
148
-
149
-
150
-
151
-
152
-
153
-
154
-
155
-
156
-
157
-
158
-
159
-
160
-
161
-
162
-
163
-
164
-
165
-
166
-
167
-
168
-
169
-
170
-
171
-
172
-
173
-
174
-
175
-
176
-
177
-
178
-
179
-
180
-
181
-
182
-
183
-
184
-
185
-
186
-
187
-
188
-
189
-
190
-
191
-
192
-
193
-
194
-
195
-
196
-
197
-
198
-
199
-
200
-
201
-
202
-
203
-
204
-
205
-
206
-
207
-
208
-
209
-
210
-
211
-
212
-
213
-
214
-
215
-
216
-
217
-
218
-
219
-
220
-
221
-
222
-
223
-
224
-
225
-
226
-
227
-
228
-
229
-
230
-
231
-
232
-
233
-
234
-
235
-
236
-
237
-
238
-
239
-
240
-
241
-
242
-
243
-
244
-
245
-
246
-
247
-
248
-
249
-
250
-
251
-
252
-
253
-
254
-
255
-
256
 |
 |

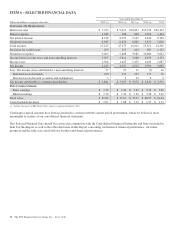
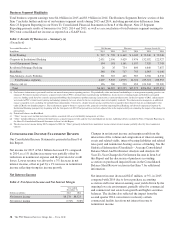
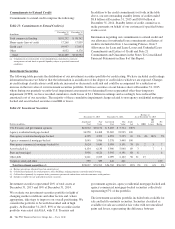
For additional detail, see the Credit Risk Management portion
of the Risk Management section and the Purchase Accounting
Accretion and Valuation of Purchased Impaired Loans portion
of the Consolidated Balance Sheet Review of this Item 7.
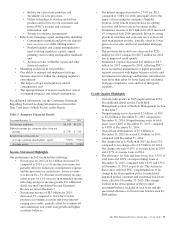
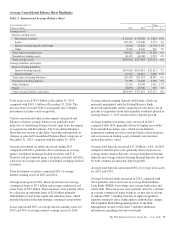
Balance Sheet, Liquidity and Capital Highlights
PNC’s balance sheet was well-positioned at December 31,
2015 reflecting strong liquidity and capital positions.
• Total loans increased by $1.9 billion to $206.7 billion
at December 31, 2015 compared to December 31,
2014.
• Total commercial lending grew $5.2 billion, or
4%, as a result of increases in commercial real
estate and commercial loans.
• Total consumer lending decreased $3.3 billion,
or 4%, due to declines in home equity,
education, and automobile loans, and included
declines in the non-strategic consumer loan
portfolio.
• Total deposits increased $16.8 billion, or 7%, to
$249.0 billion at December 31, 2015 compared with
December 31, 2014, reflecting overall strong deposit
growth.
• Investment securities increased $14.7 billion, or 26%,
to $70.5 billion at December 31, 2015 compared to
December 31, 2014.
• PNC’s balance sheet remained core funded with a
loans to deposits ratio of 83% at December 31, 2015.
• PNC maintained a strong liquidity position.
• New regulatory short-term liquidity standards
became effective for PNC and PNC Bank as
advanced approaches banking organizations
beginning January 1, 2015, with a minimum
phased-in Liquidity Coverage Ratio (LCR)
requirement of 80% in 2015, calculated as of
month end.
• The Liquidity Coverage Ratio at December 31,
2015 exceeded 100% for both PNC and PNC
Bank.
• PNC maintained a strong capital position.
• The Transitional Basel III common equity Tier
1 capital ratio was 10.6% at December 31,
2015 and 10.9% at December 31, 2014,
calculated using the regulatory capital
methodologies applicable to PNC during 2015
and 2014, respectively.
• Pro forma fully phased-in Basel III common
equity Tier 1 capital ratio was an estimated
10.0% at both December 31, 2015 and
December 31, 2014 based on the standardized
approach rules. See the Capital discussion and
Table 19 in the Consolidated Balance Sheet
Review section of this Item 7 and the
December 31, 2014 capital ratio tables in the
Statistical Information (Unaudited) section in
Item 8 of this Report for more detail.
• PNC returned capital to shareholders during 2015.
• For full year 2015, PNC repurchased
22.3 million common shares for $2.1 billion.
• In April 2015, the Board of Directors raised the
quarterly cash dividend on common stock to 51
cents per share, an increase of 3 cents per
share, or 6%, effective with the May dividend.
• In May 2015, we redeemed $500 million of
PNC’s Fixed-to-Floating Rate Non-Cumulative
Perpetual Preferred Stock, Series K, as well as
all Depositary Shares representing interests
therein.
See the Capital portion of the Consolidated Balance Sheet
Review for more detail on the 2015 preferred stock
redemption and common share repurchases, including the
completion of share repurchases included in our 2014 capital
plan and repurchases authorized by our 2015 capital plan, and
the Liquidity Risk Management portion of the Risk
Management section of this Item 7 for more detail on our
other 2015 capital and liquidity actions.
Our ability to take certain capital actions, including plans to
pay or increase common stock dividends or to repurchase
shares under current or future programs, is subject to the
results of the supervisory assessment of capital adequacy
undertaken by the Federal Reserve as part of the CCAR
process. For additional information, see the Supervision and
Regulation section in Item 1 Business of this Report.
Our Consolidated Income Statement and Consolidated
Balance Sheet Review sections of this Item 7 describe in
greater detail the various items that impacted our results
during 2015 and 2014 and balances at December 31, 2015 and
December 31, 2014, respectively.
36 The PNC Financial Services Group, Inc. – Form 10-K