PNC Bank 2015 Annual Report Download - page 72
Download and view the complete annual report
Please find page 72 of the 2015 PNC Bank annual report below. You can navigate through the pages in the report by either clicking on the pages listed below, or by using the keyword search tool below to find specific information within the annual report.-
 1
1 -
2
-
3
-
4
-
5
-
6
-
7
-
8
-
9
-
10
-
11
-
12
-
13
-
14
-
15
-
16
-
17
-
18
-
19
-
20
-
21
-
22
-
23
-
24
-
25
-
26
-
27
-
28
-
29
-
30
-
31
-
32
-
33
-
34
-
35
-
36
-
37
-
38
-
39
-
40
-
41
-
42
-
43
-
44
-
45
-
46
-
47
-
48
-
49
-
50
-
51
-
52
-
53
-
54
-
55
-
56
-
57
-
58
-
59
-
60
-
61
-
 62
62 -
 63
63 -
 64
64 -
 65
65 -
 66
66 -
 67
67 -
 68
68 -
 69
69 -
 70
70 -
 71
71 -
 72
72 -
 73
73 -
 74
74 -
 75
75 -
 76
76 -
 77
77 -
 78
78 -
 79
79 -
 80
80 -
 81
81 -
 82
82 -
83
-
84
-
85
-
86
-
87
-
88
-
89
-
90
-
91
-
92
-
93
-
94
-
95
-
96
-
97
-
98
-
99
-
100
-
101
-
102
-
103
-
104
-
105
-
106
-
107
-
108
-
109
-
110
-
111
-
112
-
113
-
114
-
115
-
116
-
117
-
118
-
119
-
120
-
121
-
122
-
123
-
124
-
125
-
126
-
127
-
128
-
129
-
130
-
131
-
132
-
133
-
134
-
135
-
136
-
137
-
138
-
139
-
140
-
141
-
142
-
143
-
144
-
145
-
146
-
147
-
148
-
149
-
150
-
151
-
152
-
153
-
154
-
155
-
156
-
157
-
158
-
159
-
160
-
161
-
162
-
163
-
164
-
165
-
166
-
167
-
168
-
169
-
170
-
171
-
172
-
173
-
174
-
175
-
176
-
177
-
178
-
179
-
180
-
181
-
182
-
183
-
184
-
185
-
186
-
187
-
188
-
189
-
190
-
191
-
192
-
193
-
194
-
195
-
196
-
197
-
198
-
199
-
200
-
201
-
202
-
203
-
204
-
205
-
206
-
207
-
208
-
209
-
210
-
211
-
212
-
213
-
214
-
215
-
216
-
217
-
218
-
219
-
220
-
221
-
222
-
223
-
224
-
225
-
226
-
227
-
228
-
229
-
230
-
231
-
232
-
233
-
234
-
235
-
236
-
237
-
238
-
239
-
240
-
241
-
242
-
243
-
244
-
245
-
246
-
247
-
248
-
249
-
250
-
251
-
252
-
253
-
254
-
255
-
256
 |
 |
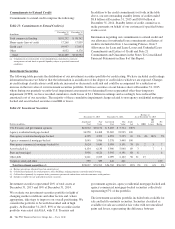
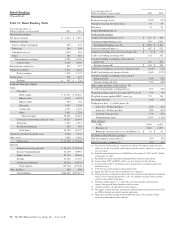
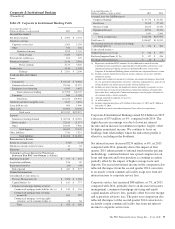
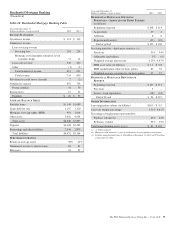
Retail Banking continued to focus on a relationship-based
lending strategy that targets specific products and markets for
growth. In 2015, average total loans declined $2.0 billion, or
3%, compared to 2014, driven by a decline in home equity
loans and declines from run-off of non-strategic portions of
the portfolios, as more fully described below.
• Average home equity loans decreased $1.2 billion, or
4%, as pay-downs and payoffs on loans exceeded
new booked volume, consistent with lower mortgage
demand. Retail Banking’s home equity loan portfolio
is relationship based, with over 97% of the portfolio
attributable to borrowers in our primary geographic
footprint.
• Average commercial & commercial real estate loans
declined $347 million, or 3%, as pay-downs and
payoffs on loans exceeded new volume.
• Average auto dealer floor plan loans declined $30
million, or 1%, primarily resulting from lower dealer
line utilization.
• Average indirect auto loans increased $245 million,
or 3%, primarily due to portfolio growth in
previously underpenetrated markets.
• Average credit card balances increased $163 million,
or 4%, as a result of efforts to increase credit card
share of wallet through organic growth.
• Average residential mortgage balances increased $79
million, or 13%, due to the transfer of $198 million in
CRA mortgage loans from the Residential Mortgage
Banking business segment in January 2015.
• In 2015, average loan balances for the remainder of
the portfolio declined $895 million, compared to
2014, driven by declines in the education and indirect
other portfolios of $901 million and $163 million,
respectively, as the discontinued government
guaranteed education loan and indirect other balances
are primarily run-off portfolios.
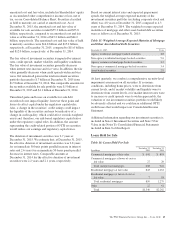
Nonperforming assets declined $153 million, or 13%, at
December 31, 2015 compared to December 31, 2014. The
decrease was driven by declines in both consumer and
commercial non-performing loans.
54 The PNC Financial Services Group, Inc. – Form 10-K