PNC Bank 2015 Annual Report Download - page 175
Download and view the complete annual report
Please find page 175 of the 2015 PNC Bank annual report below. You can navigate through the pages in the report by either clicking on the pages listed below, or by using the keyword search tool below to find specific information within the annual report.-
 1
1 -
2
-
3
-
4
-
5
-
6
-
7
-
8
-
9
-
10
-
11
-
12
-
13
-
14
-
15
-
16
-
17
-
18
-
19
-
20
-
21
-
22
-
23
-
24
-
25
-
26
-
27
-
28
-
29
-
30
-
31
-
32
-
33
-
34
-
35
-
36
-
37
-
38
-
39
-
40
-
41
-
42
-
43
-
44
-
45
-
46
-
47
-
48
-
49
-
50
-
51
-
52
-
53
-
54
-
55
-
56
-
57
-
58
-
59
-
60
-
61
-
62
-
63
-
64
-
65
-
66
-
67
-
68
-
69
-
70
-
71
-
72
-
73
-
74
-
75
-
76
-
77
-
78
-
79
-
80
-
81
-
82
-
83
-
84
-
85
-
86
-
87
-
88
-
89
-
90
-
91
-
92
-
93
-
94
-
95
-
96
-
97
-
98
-
99
-
100
-
101
-
102
-
103
-
104
-
105
-
106
-
107
-
108
-
109
-
110
-
111
-
112
-
113
-
114
-
115
-
116
-
117
-
118
-
119
-
120
-
121
-
122
-
123
-
124
-
125
-
126
-
127
-
128
-
129
-
130
-
131
-
132
-
133
-
134
-
135
-
136
-
137
-
138
-
139
-
140
-
141
-
142
-
143
-
144
-
145
-
146
-
147
-
148
-
149
-
150
-
151
-
152
-
153
-
154
-
155
-
156
-
157
-
158
-
159
-
160
-
161
-
162
-
163
-
164
-
 165
165 -
 166
166 -
 167
167 -
 168
168 -
 169
169 -
 170
170 -
 171
171 -
 172
172 -
 173
173 -
 174
174 -
 175
175 -
 176
176 -
 177
177 -
 178
178 -
 179
179 -
 180
180 -
 181
181 -
 182
182 -
 183
183 -
 184
184 -
 185
185 -
186
-
187
-
188
-
189
-
190
-
191
-
192
-
193
-
194
-
195
-
196
-
197
-
198
-
199
-
200
-
201
-
202
-
203
-
204
-
205
-
206
-
207
-
208
-
209
-
210
-
211
-
212
-
213
-
214
-
215
-
216
-
217
-
218
-
219
-
220
-
221
-
222
-
223
-
224
-
225
-
226
-
227
-
228
-
229
-
230
-
231
-
232
-
233
-
234
-
235
-
236
-
237
-
238
-
239
-
240
-
241
-
242
-
243
-
244
-
245
-
246
-
247
-
248
-
249
-
250
-
251
-
252
-
253
-
254
-
255
-
256
 |
 |

Year Ended December 31, 2014
Total realized / unrealized
gains or losses for the period (a)
Unrealized
gains (losses) on
assets and
liabilities held on
Consolidated
Balance Sheet
at Dec. 31,
2014 (b)
Level 3 Instruments Only
In millions
Fair Value
Dec. 31,
2013
Included in
Earnings
Included in
Other
comprehensive
income Purchases Sales Issuances Settlements
Transfers
into
Level 3
Transfers
out of
Level 3
Fair Value
Dec. 31,
2014
Assets
Securities available for sale
Residential mortgage-backed non-
agency $ 5,358 $120 $ 64 $ (821) $ 77(h) $4,798 $(10)
Commercial mortgage-backed non-
agency 1 (1)
Asset-backed 641 13 23 (114) 563 (1)
State and municipal 333 (2) 15 (198) $ (14) 134
Other debt 38 1 $ 1 $ (8) (2) 30
Total securities available for sale 6,370 133 102 1 (8) (1,136) 77 (14) 5,525 (11)
Financial derivatives 36 226 3 (223) 42 142
Residential mortgage loans held for
sale 8 1 15 (3) (1) 11 (25)(c) 6 1
Trading securities – Debt 32 2 (31) 29(h) 32 2
Residential mortgage servicing rights 1,087 (238) 45 $ 85 (134) 845 (231)
Commercial mortgage servicing
rights (53) 43 53 463 (i) 506 (53)
Commercial mortgage loans held for
sale 586 38 1,790 (1,521) 893 6
Equity investments -direct
investments 1,069 184 306 (407) 1,152 134
Loans 527 74 120 (153) (86) 20(c) (105)(d) 397 46
Other assets
BlackRock Series C Preferred
Stock 332 43 375 43
Other 8 715
Total other assets 340 43 7 390 43
Total assets $10,055 $410 (e) $102 $533 $(571) $1,928 $(2,669) $144 $(144) $9,788 $ 79 (f)
Liabilities
Financial derivatives (g) $ 439 $222 $ 1 $ (136) $ 526 $(51)
Other borrowed funds 199 5 $ 57 (80) 181
Other liabilities 99
Total liabilities $ 638 $227 (e) $ 1 $ 57 $ (207) $ 716 $(51) (f)
(a) Losses for assets are bracketed while losses for liabilities are not.
(b) The amount of the total gains or losses for the period included in earnings that is attributable to the change in unrealized gains or losses related to those assets and liabilities held at the
end of the reporting period.
(c) Primarily reflects the reclassification of residential mortgage loans from held for sale to portfolio loans.
(d) Reflects transfers out of Level 3 due to the transfer of residential mortgage loans to OREO.
(e) Net gains (realized and unrealized) included in earnings relating to Level 3 assets and liabilities were $454 million for 2015 compared with net gains (realized and unrealized) of $183
million for 2014. These amounts also included amortization and accretion of $147 million for 2015 compared with $146 million for 2014. The amortization and accretion amounts
were included in Interest income on the Consolidated Income Statement, and the remaining net gains/(losses) (realized and unrealized) were included in Noninterest income on the
Consolidated Income Statement.
(f) Net unrealized losses relating to those assets and liabilities held at the end of the reporting period were $189 million for 2015, compared with net unrealized gains of $130 million for
2014. These amounts were included in Noninterest income on the Consolidated Income Statement.
(g) Includes swaps entered into in connection with sales of certain Visa Class B common shares.
(h) Reflects transfers from Level 2 to Level 3 due to valuation inputs that were deemed to be unobservable.
(i) Settlements relating to commercial MSRs include $552 million, which represents the fair value as of January 1, 2014 as a result of an irrevocable election to measure all classes of
commercial MSRs at fair value. Refer to Note 8 Goodwill and Intangible Assets for additional information on commercial MSRs.
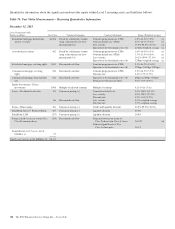
An instrument’s categorization within the hierarchy is based on the lowest level of input that is significant to the fair value
measurement. Changes from one quarter to the next related to the observability of inputs to a fair value measurement may result in
a reclassification (transfer) of assets or liabilities between hierarchy levels. PNC’s policy is to recognize transfers in and transfers
out as of the end of the reporting period.
The PNC Financial Services Group, Inc. – Form 10-K 157