PNC Bank 2015 Annual Report Download - page 77
Download and view the complete annual report
Please find page 77 of the 2015 PNC Bank annual report below. You can navigate through the pages in the report by either clicking on the pages listed below, or by using the keyword search tool below to find specific information within the annual report.-
 1
1 -
2
-
3
-
4
-
5
-
6
-
7
-
8
-
9
-
10
-
11
-
12
-
13
-
14
-
15
-
16
-
17
-
18
-
19
-
20
-
21
-
22
-
23
-
24
-
25
-
26
-
27
-
28
-
29
-
30
-
31
-
32
-
33
-
34
-
35
-
36
-
37
-
38
-
39
-
40
-
41
-
42
-
43
-
44
-
45
-
46
-
47
-
48
-
49
-
50
-
51
-
52
-
53
-
54
-
55
-
56
-
57
-
58
-
59
-
60
-
61
-
62
-
63
-
64
-
65
-
66
-
 67
67 -
 68
68 -
 69
69 -
 70
70 -
 71
71 -
 72
72 -
 73
73 -
 74
74 -
 75
75 -
 76
76 -
 77
77 -
 78
78 -
 79
79 -
 80
80 -
 81
81 -
 82
82 -
 83
83 -
 84
84 -
 85
85 -
 86
86 -
 87
87 -
88
-
89
-
90
-
91
-
92
-
93
-
94
-
95
-
96
-
97
-
98
-
99
-
100
-
101
-
102
-
103
-
104
-
105
-
106
-
107
-
108
-
109
-
110
-
111
-
112
-
113
-
114
-
115
-
116
-
117
-
118
-
119
-
120
-
121
-
122
-
123
-
124
-
125
-
126
-
127
-
128
-
129
-
130
-
131
-
132
-
133
-
134
-
135
-
136
-
137
-
138
-
139
-
140
-
141
-
142
-
143
-
144
-
145
-
146
-
147
-
148
-
149
-
150
-
151
-
152
-
153
-
154
-
155
-
156
-
157
-
158
-
159
-
160
-
161
-
162
-
163
-
164
-
165
-
166
-
167
-
168
-
169
-
170
-
171
-
172
-
173
-
174
-
175
-
176
-
177
-
178
-
179
-
180
-
181
-
182
-
183
-
184
-
185
-
186
-
187
-
188
-
189
-
190
-
191
-
192
-
193
-
194
-
195
-
196
-
197
-
198
-
199
-
200
-
201
-
202
-
203
-
204
-
205
-
206
-
207
-
208
-
209
-
210
-
211
-
212
-
213
-
214
-
215
-
216
-
217
-
218
-
219
-
220
-
221
-
222
-
223
-
224
-
225
-
226
-
227
-
228
-
229
-
230
-
231
-
232
-
233
-
234
-
235
-
236
-
237
-
238
-
239
-
240
-
241
-
242
-
243
-
244
-
245
-
246
-
247
-
248
-
249
-
250
-
251
-
252
-
253
-
254
-
255
-
256
 |
 |

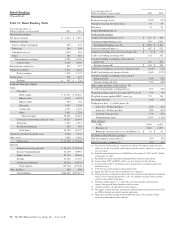
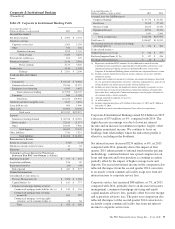
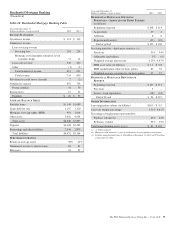
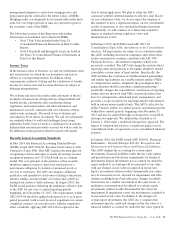
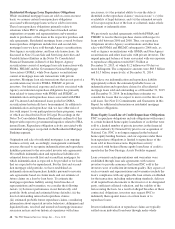
Residential Mortgage Banking
(Unaudited)
Table 24: Residential Mortgage Banking Table
Year ended December 31
Dollars in millions, except as noted 2015 2014
I
NCOME
S
TATEMENT
Net interest income $ 121 $ 149
Noninterest income
Loan servicing revenue
Servicing fees 201 224
Mortgage servicing rights valuation, net of
economic hedge 71 12
Loan sales revenue 342 420
Other (1) (5)
Total noninterest income 613 651
Total revenue 734 800
Provision for credit losses (benefit) 2 (2)
Noninterest expense 691 746
Pretax earnings 41 56
Income taxes 15 21
Earnings $ 26 $ 35
A
VERAGE
B
ALANCE
S
HEET
Portfolio loans $1,140 $1,689
Loans held for sale 1,107 1,120
Mortgage servicing rights (MSR) 991 1,014
Other assets 3,602 4,034
Total assets $6,840 $7,857
Deposits $2,428 $2,285
Borrowings and other liabilities 2,044 2,879
Total liabilities $4,472 $5,164
P
ERFORMANCE
R
ATIOS
Return on average assets .38% .45%
Noninterest income to total revenue 84 81
Efficiency 94 93
Year ended December 31
Dollars in millions, except as noted 2015 2014
R
ESIDENTIAL
M
ORTGAGE
S
ERVICING
P
ORTFOLIO
–S
ERVICED FOR
T
HIRD
P
ARTIES
(in billions)
Beginning of period $ 108 $ 114
Acquisitions 29 4
Additions 8 8
Repayments/transfers (22) (18)
End of period $ 123 $ 108
Servicing portfolio – third-party statistics: (a)
Fixed rate 95% 94%
Adjustable rate/balloon 5% 6%
Weighted-average interest rate 4.25% 4.47%
MSR asset value (in billions) $ 1.1 $ 0.8
MSR capitalization value (in basis points) 86 78
Weighted-average servicing fee (in basis points) 27 27
R
ESIDENTIAL
M
ORTGAGE
R
EPURCHASE
R
ESERVE
Beginning of period $ 107 $ 131
Provision 5 –
Losses – loan repurchases (18) (24)
End of Period $ 94 $ 107
O
THER
I
NFORMATION
Loan origination volume (in billions) $10.5 $ 9.5
Loan sale margin percentage 3.32% 4.41%
Percentage of originations represented by:
Purchase volume (b) 45% 45%
Refinance volume 55% 55%
Total nonperforming assets (a) (c) $ 81 $ 120
(a) As of December 31.
(b) Mortgages with borrowers as part of residential real estate purchase transactions.
(c) Includes nonperforming loans of $46 million at December 31, 2015 and $79 million
at December 31, 2014.
The PNC Financial Services Group, Inc. – Form 10-K 59