PNC Bank 2015 Annual Report Download - page 71
Download and view the complete annual report
Please find page 71 of the 2015 PNC Bank annual report below. You can navigate through the pages in the report by either clicking on the pages listed below, or by using the keyword search tool below to find specific information within the annual report.-
 1
1 -
2
-
3
-
4
-
5
-
6
-
7
-
8
-
9
-
10
-
11
-
12
-
13
-
14
-
15
-
16
-
17
-
18
-
19
-
20
-
21
-
22
-
23
-
24
-
25
-
26
-
27
-
28
-
29
-
30
-
31
-
32
-
33
-
34
-
35
-
36
-
37
-
38
-
39
-
40
-
41
-
42
-
43
-
44
-
45
-
46
-
47
-
48
-
49
-
50
-
51
-
52
-
53
-
54
-
55
-
56
-
57
-
58
-
59
-
60
-
 61
61 -
 62
62 -
 63
63 -
 64
64 -
 65
65 -
 66
66 -
 67
67 -
 68
68 -
 69
69 -
 70
70 -
 71
71 -
 72
72 -
 73
73 -
 74
74 -
 75
75 -
 76
76 -
 77
77 -
 78
78 -
 79
79 -
 80
80 -
 81
81 -
82
-
83
-
84
-
85
-
86
-
87
-
88
-
89
-
90
-
91
-
92
-
93
-
94
-
95
-
96
-
97
-
98
-
99
-
100
-
101
-
102
-
103
-
104
-
105
-
106
-
107
-
108
-
109
-
110
-
111
-
112
-
113
-
114
-
115
-
116
-
117
-
118
-
119
-
120
-
121
-
122
-
123
-
124
-
125
-
126
-
127
-
128
-
129
-
130
-
131
-
132
-
133
-
134
-
135
-
136
-
137
-
138
-
139
-
140
-
141
-
142
-
143
-
144
-
145
-
146
-
147
-
148
-
149
-
150
-
151
-
152
-
153
-
154
-
155
-
156
-
157
-
158
-
159
-
160
-
161
-
162
-
163
-
164
-
165
-
166
-
167
-
168
-
169
-
170
-
171
-
172
-
173
-
174
-
175
-
176
-
177
-
178
-
179
-
180
-
181
-
182
-
183
-
184
-
185
-
186
-
187
-
188
-
189
-
190
-
191
-
192
-
193
-
194
-
195
-
196
-
197
-
198
-
199
-
200
-
201
-
202
-
203
-
204
-
205
-
206
-
207
-
208
-
209
-
210
-
211
-
212
-
213
-
214
-
215
-
216
-
217
-
218
-
219
-
220
-
221
-
222
-
223
-
224
-
225
-
226
-
227
-
228
-
229
-
230
-
231
-
232
-
233
-
234
-
235
-
236
-
237
-
238
-
239
-
240
-
241
-
242
-
243
-
244
-
245
-
246
-
247
-
248
-
249
-
250
-
251
-
252
-
253
-
254
-
255
-
256
 |
 |
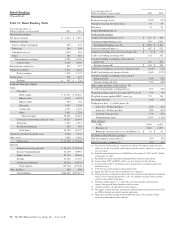
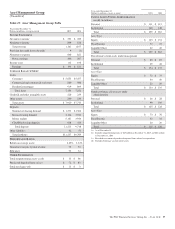
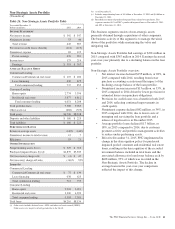
Retail Banking earned $907 million in 2015 compared with
earnings of $728 million in 2014. The increase in earnings
was driven by increased net interest income and noninterest
income, partially offset by higher noninterest expense. Retail
Banking continues to enhance the customer experience with
refinements to product offerings that drive product value for
consumers and small businesses. We are focused on growing
customer share of wallet through the sale of liquidity, banking,
and investment products that meet the broad range of financial
needs of our customers.
Retail Banking continued to focus on the strategic priority of
transforming the customer experience through transaction
migration, branch network transformation and multi-channel
sales and service strategies.
• In 2015, approximately 52% of consumer customers
used non-teller channels for the majority of their
transactions compared with 46% in 2014.
• Deposit transactions via ATM and mobile channels
increased to 43% of total deposit transactions in 2015
compared with 35% for 2014.
• Integral to PNC’s retail branch transformation
strategy, more than 375 branches operate under the
universal model designed to enhance sales
opportunities for branch personnel, in part, by driving
higher ATM and mobile deposits. During 2015, the
total branch network was reduced by 81 branches and
the ATM network was increased by 351 ATMs. PNC
had a network of 2,616 branches and 8,956 ATMs at
December 31, 2015.
• Instant debit card issuance, which enables us to print
a customer’s debit card in a matter of minutes, is now
available in nearly 700 branches, over 26% of the
branch network.
• Apple iPad™ technology is available in all of our
branches to demonstrate product capabilities to
customers and prospects.
Total revenue for 2015 increased $400 million compared to
2014, which included a $302 million increase in net interest
income primarily from the enhancements to internal funds
transfer pricing methodology in the first quarter of 2015, as
well as increases in deposit balances and interest rate spread
on the value of deposits, partially offset by lower loan
balances and interest rate spread compression on the value of
loans.
Noninterest income increased $98 million in 2015 compared
to 2014. Execution on our share of wallet strategy resulted in
strong growth in consumer service fee income from payment-
related products, specifically in debit, credit and merchant
services, as well as increased brokerage fees. Noninterest
income included gains on sales of Visa Class B common
shares of $169 million on two million shares in 2015
compared to $209 million on 3.5 million shares in 2014.
Excluding these gains, noninterest income increased $138
million, or 7%, in the comparison.
Provision for credit losses and net charge-offs in 2015
declined by $18 million and $114 million, respectively,
compared to 2014 due to improved credit quality.
Noninterest expense in 2015 increased $136 million over
2014. Increases in technology investments, sales-related and
other compensation, and customer transaction-related costs
were partially offset by reduced third party service expense
and non-credit losses, as well as lower branch network
expenses as a result of transaction migration to lower cost
digital and ATM channels.
The deposit strategy of Retail Banking is to remain disciplined
on pricing, focused on growing and retaining relationship-
based balances, executing on market specific deposit growth
strategies, and providing a source of low-cost funding and
liquidity to PNC.
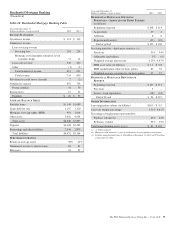
In 2015, average total deposits of $145.8 billion increased
$8.6 billion, or 6%, compared to 2014, driven by organic
growth in the following deposit categories:
• Money market deposits increased $4.3 billion, or 9%,
to $54.6 billion.
• Demand deposits increased $4.2 billion, or 7%, to
$60.3 billion.
• Savings deposits increased $2.5 billion, or 21%, to
$14.4 billion.
The expected run-off of maturing certificates of deposit
partially offset these increases, declining $2.4 billion, or 13%,
in the comparison.
The PNC Financial Services Group, Inc. – Form 10-K 53