PNC Bank 2015 Annual Report Download - page 149
Download and view the complete annual report
Please find page 149 of the 2015 PNC Bank annual report below. You can navigate through the pages in the report by either clicking on the pages listed below, or by using the keyword search tool below to find specific information within the annual report.-
 1
1 -
2
-
3
-
4
-
5
-
6
-
7
-
8
-
9
-
10
-
11
-
12
-
13
-
14
-
15
-
16
-
17
-
18
-
19
-
20
-
21
-
22
-
23
-
24
-
25
-
26
-
27
-
28
-
29
-
30
-
31
-
32
-
33
-
34
-
35
-
36
-
37
-
38
-
39
-
40
-
41
-
42
-
43
-
44
-
45
-
46
-
47
-
48
-
49
-
50
-
51
-
52
-
53
-
54
-
55
-
56
-
57
-
58
-
59
-
60
-
61
-
62
-
63
-
64
-
65
-
66
-
67
-
68
-
69
-
70
-
71
-
72
-
73
-
74
-
75
-
76
-
77
-
78
-
79
-
80
-
81
-
82
-
83
-
84
-
85
-
86
-
87
-
88
-
89
-
90
-
91
-
92
-
93
-
94
-
95
-
96
-
97
-
98
-
99
-
100
-
101
-
102
-
103
-
104
-
105
-
106
-
107
-
108
-
109
-
110
-
111
-
112
-
113
-
114
-
115
-
116
-
117
-
118
-
119
-
120
-
121
-
122
-
123
-
124
-
125
-
126
-
127
-
128
-
129
-
130
-
131
-
132
-
133
-
134
-
135
-
136
-
137
-
138
-
 139
139 -
 140
140 -
 141
141 -
 142
142 -
 143
143 -
 144
144 -
 145
145 -
 146
146 -
 147
147 -
 148
148 -
 149
149 -
 150
150 -
 151
151 -
 152
152 -
 153
153 -
 154
154 -
 155
155 -
 156
156 -
 157
157 -
 158
158 -
 159
159 -
160
-
161
-
162
-
163
-
164
-
165
-
166
-
167
-
168
-
169
-
170
-
171
-
172
-
173
-
174
-
175
-
176
-
177
-
178
-
179
-
180
-
181
-
182
-
183
-
184
-
185
-
186
-
187
-
188
-
189
-
190
-
191
-
192
-
193
-
194
-
195
-
196
-
197
-
198
-
199
-
200
-
201
-
202
-
203
-
204
-
205
-
206
-
207
-
208
-
209
-
210
-
211
-
212
-
213
-
214
-
215
-
216
-
217
-
218
-
219
-
220
-
221
-
222
-
223
-
224
-
225
-
226
-
227
-
228
-
229
-
230
-
231
-
232
-
233
-
234
-
235
-
236
-
237
-
238
-
239
-
240
-
241
-
242
-
243
-
244
-
245
-
246
-
247
-
248
-
249
-
250
-
251
-
252
-
253
-
254
-
255
-
256
 |
 |
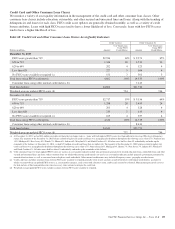
Consumer Purchased Impaired Loan Class
Estimates of the expected cash flows primarily determine the valuation of consumer purchased impaired loans. Consumer cash
flow estimates are influenced by a number of credit related items, which include, but are not limited to: estimated real estate
values, payment patterns, updated FICO scores, the current economic environment, updated LTV ratios and the date of origination.
These key factors are monitored to help ensure that concentrations of risk are managed and cash flows are maximized.
See Note 4 Purchased Loans for additional information.
Table 57: Home Equity and Residential Real Estate Balances
In millions
December 31
2015
December 31
2014
Home equity and residential real estate loans – excluding purchased impaired loans (a) $42,268 $43,348
Home equity and residential real estate loans – purchased impaired loans (b) 3,684 4,541
Government insured or guaranteed residential real estate mortgages (a) 923 1,188
Difference between outstanding balance and recorded investment in purchased impaired loans (c) (331) 7
Total home equity and residential real estate loans (a) $46,544 $49,084
(a) Represents recorded investment.
(b) Represents outstanding balance.
(c) The December 31, 2015 amount was impacted by the change in derecognition policy for purchased impaired pooled consumer and residential real estate loans. See Note 4 Purchased
Loans for additional information.
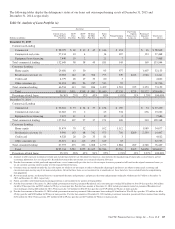
Table 58: Home Equity and Residential Real Estate Asset Quality Indicators – Excluding Purchased Impaired Loans (a) (b)
Home Equity Residential Real Estate
December 31, 2015 – in millions 1st Liens 2nd Liens Total
Current estimated LTV ratios (c)
Greater than or equal to 125% and updated FICO scores:
Greater than 660 $ 283 $ 960 $ 284 $ 1,527
Less than or equal to 660 (d) (e) 40 189 68 297
Missing FICO 1 8 5 14
Greater than or equal to 100% to less than 125% and updated FICO scores:
Greater than 660 646 1,733 564 2,943
Less than or equal to 660 (d) (e) 92 302 102 496
Missing FICO 3 4 8 15
Greater than or equal to 90% to less than 100% and updated FICO scores:
Greater than 660 698 1,492 615 2,805
Less than or equal to 660 88 226 94 408
Missing FICO 1 3 10 14
Less than 90% and updated FICO scores:
Greater than 660 13,895 7,808 9,117 30,820
Less than or equal to 660 1,282 923 570 2,775
Missing FICO 31 18 105 154
Total home equity and residential real estate loans $17,060 $13,666 $11,542 $42,268
(continued on following page)
The PNC Financial Services Group, Inc. – Form 10-K 131