PNC Bank 2015 Annual Report Download - page 51
Download and view the complete annual report
Please find page 51 of the 2015 PNC Bank annual report below. You can navigate through the pages in the report by either clicking on the pages listed below, or by using the keyword search tool below to find specific information within the annual report.
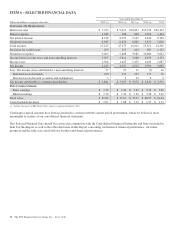
At or for the year ended December 31
Dollars in millions, except as noted 2015 (a) 2014 (a) 2013 (a) 2012 (a) 2011
B
ALANCE
S
HEET
H
IGHLIGHTS
Assets (b) $358,493 $345,072 $320,192 $305,029 $271,141
Loans (b) (c) 206,696 204,817 195,613 185,856 159,014
Allowance for loan and lease losses (b) 2,727 3,331 3,609 4,036 4,347
Interest-earning deposits with banks (b) (d) 30,546 31,779 12,135 3,984 1,169
Investment securities (b) 70,528 55,823 60,294 61,406 60,634
Loans held for sale (c) 1,540 2,262 2,255 3,693 2,936
Goodwill 9,103 9,103 9,074 9,072 8,285
Mortgage servicing rights 1,589 1,351 1,636 1,071 1,117
Equity investments (b) (e) 10,587 10,728 10,560 10,799 10,070
Other assets (b) (c) 23,092 23,482 22,552 23,679 22,698
Noninterest-bearing deposits 79,435 73,479 70,306 69,980 59,048
Interest-bearing deposits 169,567 158,755 150,625 143,162 128,918
Total deposits 249,002 232,234 220,931 213,142 187,966
Borrowed funds (b) (c) (f) 54,532 56,768 46,105 40,907 36,704
Total shareholders’ equity 44,710 44,551 42,334 38,948 34,010
Common shareholders’ equity 41,258 40,605 38,392 35,358 32,374
Accumulated other comprehensive income (loss) 130 503 436 834 (105)
C
LIENT
I
NVESTMENT
A
SSETS
(billions)
Discretionary client assets under management $ 134 $ 135 $ 127 $ 112 $ 107
Nondiscretionary client assets under management 125 128 120 112 103
Total client assets under administration 259 263 247 224 210
Brokerage account client assets 43 43 41 38 34
Total $ 302 $ 306 $ 288 $ 262 $ 244
S
ELECTED
R
ATIOS
Net interest margin (g) 2.74% 3.08% 3.57% 3.94% 3.92%
Noninterest income to total revenue 46 45 43 38 39
Efficiency 62 62 60 68 63
Return on
Average common shareholders’ equity 9.50 9.91 10.85 8.29 9.56
Average assets 1.17 1.28 1.38 1.02 1.16
Loans to deposits 83 88 89 87 85
Dividend payout 27.0 25.3 23.1 29.1 20.2
Transitional Basel III common equity Tier 1 capital ratio (h) (i) (j) 10.6 10.9 N/A N/A N/A
Transitional Basel III Tier 1 risk-based capital ratio (h) (i) (j) 12.0 12.6 N/A N/A N/A
Pro forma fully phased-in Basel III common equity Tier 1 capital ratio (i) (j) (k) 10.0 10.0 9.4 7.5 N/A
Basel I Tier 1 common capital ratio (j) N/A N/A 10.5 9.6 10.3
Basel I Tier 1 risk-based capital ratio (j) N/A N/A 12.4 11.6 12.6
Common shareholders’ equity to total assets 11.5 11.8 12.0 11.6 11.9
Average common shareholders’ equity to average assets 11.5 12.1 11.9 11.5 11.9
S
ELECTED
S
TATISTICS
Employees 52,513 53,587 54,433 56,285 51,891
Retail Banking branches 2,616 2,697 2,714 2,881 2,511
ATMs 8,956 8,605 7,445 7,282 6,806
Residential mortgage servicing portfolio – Serviced for Third Parties (in billions) $ 123 $ 108 $ 114 $ 119 $ 118
Commercial loan servicing portfolio – Serviced for PNC and Others (in billions) $ 447 $ 377 $ 347 $ 322 $ 309
(a) Includes the impact of RBC Bank (USA), which we acquired on March 2, 2012.
(b) Amounts include consolidated variable interest entities. See Consolidated Balance Sheet in Item 8 of this Report for additional information.
(c) Amounts include assets and liabilities for which we have elected the fair value option. See Consolidated Balance Sheet in Item 8 of this Report for additional information.
(d) Amounts include balances held with the Federal Reserve Bank of Cleveland of $30.0 billion, $31.4 billion, $11.7 billion, $3.5 billion and $.4 billion as of December 31, 2015, 2014,
2013, 2012 and 2011, respectively.
(e) Amounts include our equity interest in BlackRock.
(f) Includes long-term borrowings of $43.6 billion, $41.5 billion, $27.6 billion, $19.3 billion and $20.9 billion for 2015, 2014, 2013, 2012 and 2011, respectively. Borrowings which
mature more than one year after December 31, 2015 are considered to be long-term.
(g) Calculated as taxable-equivalent net interest income divided by average earning assets. The interest income earned on certain earning assets is completely or partially exempt from
federal income tax. As such, these tax-exempt instruments typically yield lower returns than taxable investments. To provide more meaningful comparisons of net interest margins for
all earning assets, we use net interest income on a taxable-equivalent basis in calculating net interest margin by increasing the interest income earned on tax-exempt assets to make it
fully equivalent to interest income earned on taxable investments. This adjustment is not permitted under accounting principles generally accepted in the United States of America
(GAAP) on the Consolidated Income Statement. The taxable-equivalent adjustments to net interest income for the years 2015, 2014, 2013, 2012 and 2011 were $196 million, $189
million, $168 million, $144 million and $104 million, respectively.
(h) Calculated using the regulatory capital methodology applicable to PNC during 2015 and 2014, respectively.
(i) See capital ratios discussion in the Supervision and Regulation section of Item 1 and in the Capital portion of the Consolidated Balance Sheet Review section in Item 7 of this Report
for additional discussion on these capital ratios.
(j) See additional information on the pro forma ratios, the 2014 Transitional Basel III ratios and Basel I ratios in the Statistical Information (Unaudited) section in Item 8 of this Report.
(k) Pro forma ratios as of December 31, 2015, December 31, 2014 and December 31, 2013 were calculated under the standardized approach and the pro forma ratio as of December 31,
2012 was calculated under the advanced approaches. The 2012 and 2013 ratios have not been updated to reflect the first quarter 2014 adoption of ASU 2014-01 related to investments
in low income housing tax credits.
The PNC Financial Services Group, Inc. – Form 10-K 33


