PNC Bank 2015 Annual Report Download - page 228
Download and view the complete annual report
Please find page 228 of the 2015 PNC Bank annual report below. You can navigate through the pages in the report by either clicking on the pages listed below, or by using the keyword search tool below to find specific information within the annual report.-
 1
1 -
2
-
3
-
4
-
5
-
6
-
7
-
8
-
9
-
10
-
11
-
12
-
13
-
14
-
15
-
16
-
17
-
18
-
19
-
20
-
21
-
22
-
23
-
24
-
25
-
26
-
27
-
28
-
29
-
30
-
31
-
32
-
33
-
34
-
35
-
36
-
37
-
38
-
39
-
40
-
41
-
42
-
43
-
44
-
45
-
46
-
47
-
48
-
49
-
50
-
51
-
52
-
53
-
54
-
55
-
56
-
57
-
58
-
59
-
60
-
61
-
62
-
63
-
64
-
65
-
66
-
67
-
68
-
69
-
70
-
71
-
72
-
73
-
74
-
75
-
76
-
77
-
78
-
79
-
80
-
81
-
82
-
83
-
84
-
85
-
86
-
87
-
88
-
89
-
90
-
91
-
92
-
93
-
94
-
95
-
96
-
97
-
98
-
99
-
100
-
101
-
102
-
103
-
104
-
105
-
106
-
107
-
108
-
109
-
110
-
111
-
112
-
113
-
114
-
115
-
116
-
117
-
118
-
119
-
120
-
121
-
122
-
123
-
124
-
125
-
126
-
127
-
128
-
129
-
130
-
131
-
132
-
133
-
134
-
135
-
136
-
137
-
138
-
139
-
140
-
141
-
142
-
143
-
144
-
145
-
146
-
147
-
148
-
149
-
150
-
151
-
152
-
153
-
154
-
155
-
156
-
157
-
158
-
159
-
160
-
161
-
162
-
163
-
164
-
165
-
166
-
167
-
168
-
169
-
170
-
171
-
172
-
173
-
174
-
175
-
176
-
177
-
178
-
179
-
180
-
181
-
182
-
183
-
184
-
185
-
186
-
187
-
188
-
189
-
190
-
191
-
192
-
193
-
194
-
195
-
196
-
197
-
198
-
199
-
200
-
201
-
202
-
203
-
204
-
205
-
206
-
207
-
208
-
209
-
210
-
211
-
212
-
213
-
214
-
215
-
216
-
217
-
 218
218 -
 219
219 -
 220
220 -
 221
221 -
 222
222 -
 223
223 -
 224
224 -
 225
225 -
 226
226 -
 227
227 -
 228
228 -
 229
229 -
 230
230 -
 231
231 -
 232
232 -
 233
233 -
 234
234 -
 235
235 -
 236
236 -
 237
237 -
 238
238 -
239
-
240
-
241
-
242
-
243
-
244
-
245
-
246
-
247
-
248
-
249
-
250
-
251
-
252
-
253
-
254
-
255
-
256
 |
 |

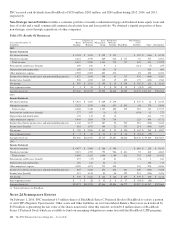
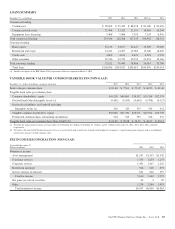
Table 137: Parent Company – Statement of Cash Flows
Year ended December 31 – in millions 2015 2014 2013
Operating Activities
Net income $ 4,106 $ 4,184 $ 4,201
Adjustments to reconcile net income
to net cash provided by operating
activities:
Equity in undistributed net
earnings of subsidiaries (995) (1,083) (974)
Other 163 118 152
Net cash provided (used) by
operating activities 3,274 3,219 3,379
Investing Activities
Net capital returned from
(contributed to) subsidiaries 87
Net change in Restricted deposits
with banking subsidiary 400
Net change in nonrestricted interest-
earning deposits 866 (1,792) (214)
Net change in restricted interest-
earning deposits (300)
Other (81) (79) (60)
Net cash provided (used) by
investing activities 885 (1,871) (187)
Financing Activities
Borrowings from subsidiaries 1,593 2,430 3,624
Repayments on borrowings from
subsidiaries (1,599) (2,392) (5,767)
Other borrowed funds (382) 770 (467)
Preferred stock – Other issuances 495
Preferred stock – Other redemptions (500) (150)
Common and treasury stock
issuances 139 252 244
Acquisition of treasury stock (2,152) (1,176) (24)
Preferred stock cash dividends paid (219) (232) (237)
Common stock cash dividends paid (1,039) (1,000) (911)
Net cash provided (used) by
financing activities (4,159) (1,348) (3,193)
Increase (decrease) in cash and due
from banks (1)
Cash held at banking subsidiary at
beginning of year 1 1 2
Cash held at banking subsidiary at
end of year $ 1 $ 1 $ 1
N
OTE
23 S
EGMENT
R
EPORTING
We have six reportable business segments:
• Retail Banking
• Corporate & Institutional Banking
• Asset Management Group
• Residential Mortgage Banking
• BlackRock
• Non-Strategic Assets Portfolio
Results of individual businesses are presented based on our
internal management reporting practices. There is no
comprehensive, authoritative body of guidance for
management accounting equivalent to GAAP; therefore, the
financial results of our individual businesses are not
necessarily comparable with similar information for any other
company. We periodically refine our internal methodologies
as management reporting practices are enhanced. To the
extent significant and practicable, retrospective application of
new methodologies is made to prior period reportable business
segment results and disclosures to create comparability with
the current period.
Financial results are presented, to the extent practicable, as if
each business operated on a stand-alone basis. Additionally,
we have aggregated the results for corporate support functions
within “Other” for financial reporting purposes.
Net interest income in business segment results reflects PNC’s
internal funds transfer pricing methodology. Assets receive a
funding charge and liabilities and capital receive a funding
credit based on a transfer pricing methodology that incorporates
product repricing characteristics, tenor and other factors. In the
first quarter of 2015, enhancements were made to PNC’s funds
transfer pricing methodology primarily for costs related to the
new regulatory short-term liquidity standards. The
enhancements incorporate an additional charge assigned to
assets, including for unfunded loan commitments. Conversely, a
higher transfer pricing credit has been assigned to those
deposits that are accorded higher value under Liquidity
Coverage Ratio (LCR) rules for liquidity purposes. Please see
the Supervision and Regulation section in Item 1 and the
Liquidity Risk Management section in Item 7 of this Report for
more information about the LCR. These adjustments apply to
business segment results, primarily favorably impacting Retail
Banking and adversely impacting Corporate & Institutional
Banking, prospectively beginning with the first quarter of 2015.
Prior periods have not been adjusted due to the impracticability
of estimating the impact of the change for prior periods.
A portion of capital is intended to cover unexpected losses and
is assigned to our business segments using our risk-based
economic capital model, including consideration of the
goodwill at those business segments, as well as the
diversification of risk among the business segments, ultimately
reflecting PNC’s portfolio risk adjusted capital allocation.
210 The PNC Financial Services Group, Inc. – Form 10-K