PNC Bank 2015 Annual Report Download - page 58
Download and view the complete annual report
Please find page 58 of the 2015 PNC Bank annual report below. You can navigate through the pages in the report by either clicking on the pages listed below, or by using the keyword search tool below to find specific information within the annual report.-
 1
1 -
2
-
3
-
4
-
5
-
6
-
7
-
8
-
9
-
10
-
11
-
12
-
13
-
14
-
15
-
16
-
17
-
18
-
19
-
20
-
21
-
22
-
23
-
24
-
25
-
26
-
27
-
28
-
29
-
30
-
31
-
32
-
33
-
34
-
35
-
36
-
37
-
38
-
39
-
40
-
41
-
42
-
43
-
44
-
45
-
46
-
47
-
 48
48 -
 49
49 -
 50
50 -
 51
51 -
 52
52 -
 53
53 -
 54
54 -
 55
55 -
 56
56 -
 57
57 -
 58
58 -
 59
59 -
 60
60 -
 61
61 -
 62
62 -
 63
63 -
 64
64 -
 65
65 -
 66
66 -
 67
67 -
 68
68 -
69
-
70
-
71
-
72
-
73
-
74
-
75
-
76
-
77
-
78
-
79
-
80
-
81
-
82
-
83
-
84
-
85
-
86
-
87
-
88
-
89
-
90
-
91
-
92
-
93
-
94
-
95
-
96
-
97
-
98
-
99
-
100
-
101
-
102
-
103
-
104
-
105
-
106
-
107
-
108
-
109
-
110
-
111
-
112
-
113
-
114
-
115
-
116
-
117
-
118
-
119
-
120
-
121
-
122
-
123
-
124
-
125
-
126
-
127
-
128
-
129
-
130
-
131
-
132
-
133
-
134
-
135
-
136
-
137
-
138
-
139
-
140
-
141
-
142
-
143
-
144
-
145
-
146
-
147
-
148
-
149
-
150
-
151
-
152
-
153
-
154
-
155
-
156
-
157
-
158
-
159
-
160
-
161
-
162
-
163
-
164
-
165
-
166
-
167
-
168
-
169
-
170
-
171
-
172
-
173
-
174
-
175
-
176
-
177
-
178
-
179
-
180
-
181
-
182
-
183
-
184
-
185
-
186
-
187
-
188
-
189
-
190
-
191
-
192
-
193
-
194
-
195
-
196
-
197
-
198
-
199
-
200
-
201
-
202
-
203
-
204
-
205
-
206
-
207
-
208
-
209
-
210
-
211
-
212
-
213
-
214
-
215
-
216
-
217
-
218
-
219
-
220
-
221
-
222
-
223
-
224
-
225
-
226
-
227
-
228
-
229
-
230
-
231
-
232
-
233
-
234
-
235
-
236
-
237
-
238
-
239
-
240
-
241
-
242
-
243
-
244
-
245
-
246
-
247
-
248
-
249
-
250
-
251
-
252
-
253
-
254
-
255
-
256
 |
 |

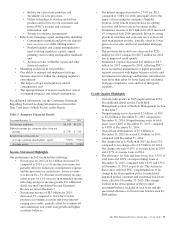
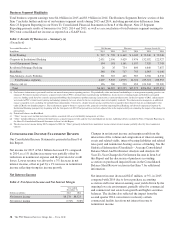
Provision For Credit Losses
The provision for credit losses totaled $255 million in 2015
compared with $273 million in 2014, reflecting improved
credit quality.
We expect our provision for credit losses in the first quarter of
2016 to be between $75 million and $125 million. The
performance of certain energy related loans during the first
quarter could result in provision for credit losses at the high
end of this range.
The Credit Risk Management portion of the Risk Management
section of this Item 7 includes additional information
regarding factors impacting the provision for credit losses.
Noninterest Expense
Noninterest expense decreased $25 million to $9.5 billion in
2015 compared to 2014, reflecting PNC’s focus on expense
management. Higher personnel expense associated with
higher business activity and investments in technology and
business infrastructure were more than offset by lower legal
and residential mortgage compliance costs and third party
expenses, as well as the impact of the fourth quarter 2014
contribution to the PNC Foundation.
During 2015, we completed actions and exceeded our 2015
continuous improvement program goal of $500 million in cost
savings. The program focuses on reducing costs in part to fund
investments in technology and business infrastructure. In
2016, we have a goal of $400 million in cost savings through
our continuous improvement program, which we expect will
help to fund a significant portion of our business and
technology investments.
For the first quarter of 2016, we expect noninterest expense to
be down low-single digits, on a percentage basis, compared
with the fourth quarter of 2015. For full year 2016, we expect
total noninterest expense to be stable compared to 2015.
Effective Income Tax Rate
The effective income tax rate was 24.8% for 2015 compared
with 25.1% for 2014. The effective tax rate is generally lower
than the statutory rate primarily due to tax credits PNC
receives from our investments in low income housing and new
markets investments, as well as earnings in other tax exempt
investments.
The effective tax rate for 2015 included tax benefits
attributable to settling acquired entity tax contingencies.
We expect our 2016 effective tax rate to be between 25% and
26%.
C
ONSOLIDATED
B
ALANCE
S
HEET
R
EVIEW
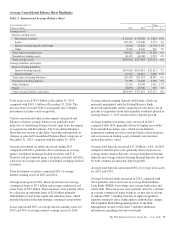
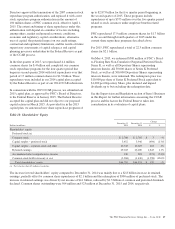
Table 6: Summarized Balance Sheet Data
Dollars in millions
December 31
2015
December 31
2014
Change
$%
Assets
Interest-earning deposits with banks $30,546 $31,779 $(1,233) (4)%
Loans held for sale 1,540 2,262 (722) (32)%
Investment securities 70,528 55,823 14,705 26%
Loans 206,696 204,817 1,879 1%
Allowance for loan and lease losses (2,727) (3,331) 604 (18)%
Goodwill 9,103 9,103 – –%
Mortgage servicing rights 1,589 1,351 238 18%
Other intangible assets 379 493 (114) (23)%
Other, net 40,839 42,775 (1,936) (5)%
Total assets $358,493 $345,072 $13,421 4%
Liabilities
Deposits $249,002 $232,234 $16,768 7%
Borrowed funds 54,532 56,768 (2,236) (4)%
Other 8,979 9,996 (1,017) (10)%
Total liabilities 312,513 298,998 13,515 5%
Equity
Total shareholders’ equity 44,710 44,551 159 –%
Noncontrolling interests 1,270 1,523 (253) (17)%
Total equity 45,980 46,074 (94) –%
Total liabilities and equity $358,493 $345,072 $13,421 4%
40 The PNC Financial Services Group, Inc. – Form 10-K