PNC Bank 2015 Annual Report Download - page 78
Download and view the complete annual report
Please find page 78 of the 2015 PNC Bank annual report below. You can navigate through the pages in the report by either clicking on the pages listed below, or by using the keyword search tool below to find specific information within the annual report.-
 1
1 -
2
-
3
-
4
-
5
-
6
-
7
-
8
-
9
-
10
-
11
-
12
-
13
-
14
-
15
-
16
-
17
-
18
-
19
-
20
-
21
-
22
-
23
-
24
-
25
-
26
-
27
-
28
-
29
-
30
-
31
-
32
-
33
-
34
-
35
-
36
-
37
-
38
-
39
-
40
-
41
-
42
-
43
-
44
-
45
-
46
-
47
-
48
-
49
-
50
-
51
-
52
-
53
-
54
-
55
-
56
-
57
-
58
-
59
-
60
-
61
-
62
-
63
-
64
-
65
-
66
-
67
-
 68
68 -
 69
69 -
 70
70 -
 71
71 -
 72
72 -
 73
73 -
 74
74 -
 75
75 -
 76
76 -
 77
77 -
 78
78 -
 79
79 -
 80
80 -
 81
81 -
 82
82 -
 83
83 -
 84
84 -
 85
85 -
 86
86 -
 87
87 -
 88
88 -
89
-
90
-
91
-
92
-
93
-
94
-
95
-
96
-
97
-
98
-
99
-
100
-
101
-
102
-
103
-
104
-
105
-
106
-
107
-
108
-
109
-
110
-
111
-
112
-
113
-
114
-
115
-
116
-
117
-
118
-
119
-
120
-
121
-
122
-
123
-
124
-
125
-
126
-
127
-
128
-
129
-
130
-
131
-
132
-
133
-
134
-
135
-
136
-
137
-
138
-
139
-
140
-
141
-
142
-
143
-
144
-
145
-
146
-
147
-
148
-
149
-
150
-
151
-
152
-
153
-
154
-
155
-
156
-
157
-
158
-
159
-
160
-
161
-
162
-
163
-
164
-
165
-
166
-
167
-
168
-
169
-
170
-
171
-
172
-
173
-
174
-
175
-
176
-
177
-
178
-
179
-
180
-
181
-
182
-
183
-
184
-
185
-
186
-
187
-
188
-
189
-
190
-
191
-
192
-
193
-
194
-
195
-
196
-
197
-
198
-
199
-
200
-
201
-
202
-
203
-
204
-
205
-
206
-
207
-
208
-
209
-
210
-
211
-
212
-
213
-
214
-
215
-
216
-
217
-
218
-
219
-
220
-
221
-
222
-
223
-
224
-
225
-
226
-
227
-
228
-
229
-
230
-
231
-
232
-
233
-
234
-
235
-
236
-
237
-
238
-
239
-
240
-
241
-
242
-
243
-
244
-
245
-
246
-
247
-
248
-
249
-
250
-
251
-
252
-
253
-
254
-
255
-
256
 |
 |

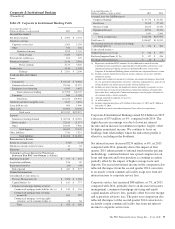
Residential Mortgage Banking earned $26 million in 2015
compared to $35 million in 2014. Earnings decreased from the
prior year as higher net hedging gains on residential mortgage
servicing rights and lower noninterest expense were more than
offset by lower loan sales and servicing revenue and decreased
net interest income.
The strategic focus of the business is the acquisition of new
customers through a retail loan officer sales force with an
emphasis on home purchase transactions. Our strategy
involves competing on the basis of superior service to new
and existing customers in serving their home purchase and
refinancing needs. A key consideration in pursuing this
approach is the cross-sell opportunity, especially in the bank
footprint markets.
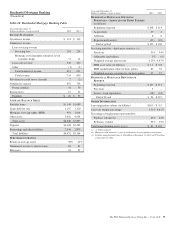
Residential Mortgage Banking overview:
• Total loan originations increased $1 billion in 2015
compared to 2014. Loans continue to be originated
primarily through direct channels under FNMA,
FHLMC and FHA/Department of Veterans Affairs
agency guidelines. Refinancings were 55% of
originations for both 2015 and 2014. During 2015,
12% of loan originations were under the original or
revised Home Affordable Refinance Program (HARP
or HARP 2).
• Residential mortgage loans serviced for others
increased $15 billion at December 31, 2015
compared to December 31, 2014. During 2015, $29
billion of residential mortgage servicing rights were
acquired, compared with $4 billion in 2014.
• Net interest income decreased $28 million in 2015
compared to 2014, primarily due to lower balances of
portfolio loans held for investment.
• Noninterest income declined $38 million in 2015
compared with the prior year period, as increased net
hedging gains on residential mortgage servicing
rights were more than offset by decreased loan sales
and servicing revenue.
• Noninterest expense declined $55 million in 2015
compared with the 2014 period, primarily as a result
of lower legal accruals and mortgage compliance
costs.
• Investors having purchased mortgage loans may
request PNC to indemnify them against losses on
certain loans or to repurchase loans that they believe
do not comply with applicable contractual loan
origination covenants and representations and
warranties we have made. At December 31, 2015, the
liability for estimated losses on repurchase and
indemnification claims for the Residential Mortgage
Banking business segment was $94 million,
compared with $107 million at December 31, 2014.
See the Recourse and Repurchase Obligations section
of this Item 7 and Note 21 Commitments and
Guarantees in the Notes To Consolidated Financial
Statements of this Report for additional information.
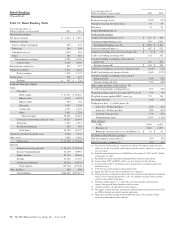
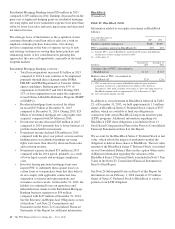
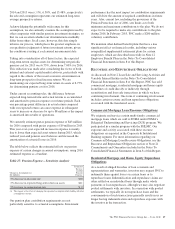
BlackRock
(Unaudited)
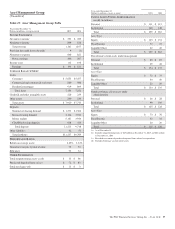
Table 25: BlackRock Table
Information related to our equity investment in BlackRock
follows:
Year ended December 31
Dollars in millions 2015 2014
Business segment earnings (a) $548 $530
PNC’s economic interest in BlackRock (b) 22% 22%
(a) Includes PNC’s share of BlackRock’s reported GAAP earnings and additional
income taxes on those earnings incurred by PNC.
(b) At December 31.
In billions
December 31
2015
December 31
2014
Carrying value of PNC’s investment in
BlackRock (c) $ 6.7 $ 6.3
Market value of PNC’s investment in
BlackRock (d) 12.0 12.6
(c) PNC accounts for its investment in BlackRock under the equity method of
accounting, exclusive of a related deferred tax liability of $2.2 billion at
December 31, 2015 and $2.1 billion at December 31, 2014. Our voting interest in
BlackRock common stock was approximately 21% at December 31, 2015.
(d) Does not include liquidity discount.
In addition to our investment in BlackRock reflected in Table
25, at December 31, 2015, we held approximately 1.3 million
shares of BlackRock Series C Preferred Stock valued at $357
million, which are available to fund our obligation in
connection with certain BlackRock long-term incentive plan
(LTIP) programs. Additional information regarding our
BlackRock LTIP share obligations is included in Note 13
Stock Based Compensation Plans in the Notes to Consolidated
Financial Statements in Item 8 of this Report.
We account for the BlackRock Series C Preferred Stock at fair
value, which offsets the impact of marking-to-market the
obligation to deliver these shares to BlackRock. The fair value
amount of the BlackRock Series C Preferred Stock is included
on our Consolidated Balance Sheet in the caption Other assets.
Additional information regarding the valuation of the
BlackRock Series C Preferred Stock is included in Note 7 Fair
Value in the Notes To Consolidated Financial Statements in
Item 8 of this Report.
See Note 24 Subsequent Events in Item 8 of this Report for
information on our February 1, 2016 transfer of 0.5 million
shares of Series C Preferred Stock to BlackRock to satisfy a
portion of our LTIP obligation.
60 The PNC Financial Services Group, Inc. – Form 10-K