PNC Bank 2015 Annual Report Download - page 145
Download and view the complete annual report
Please find page 145 of the 2015 PNC Bank annual report below. You can navigate through the pages in the report by either clicking on the pages listed below, or by using the keyword search tool below to find specific information within the annual report.-
 1
1 -
2
-
3
-
4
-
5
-
6
-
7
-
8
-
9
-
10
-
11
-
12
-
13
-
14
-
15
-
16
-
17
-
18
-
19
-
20
-
21
-
22
-
23
-
24
-
25
-
26
-
27
-
28
-
29
-
30
-
31
-
32
-
33
-
34
-
35
-
36
-
37
-
38
-
39
-
40
-
41
-
42
-
43
-
44
-
45
-
46
-
47
-
48
-
49
-
50
-
51
-
52
-
53
-
54
-
55
-
56
-
57
-
58
-
59
-
60
-
61
-
62
-
63
-
64
-
65
-
66
-
67
-
68
-
69
-
70
-
71
-
72
-
73
-
74
-
75
-
76
-
77
-
78
-
79
-
80
-
81
-
82
-
83
-
84
-
85
-
86
-
87
-
88
-
89
-
90
-
91
-
92
-
93
-
94
-
95
-
96
-
97
-
98
-
99
-
100
-
101
-
102
-
103
-
104
-
105
-
106
-
107
-
108
-
109
-
110
-
111
-
112
-
113
-
114
-
115
-
116
-
117
-
118
-
119
-
120
-
121
-
122
-
123
-
124
-
125
-
126
-
127
-
128
-
129
-
130
-
131
-
132
-
133
-
134
-
 135
135 -
 136
136 -
 137
137 -
 138
138 -
 139
139 -
 140
140 -
 141
141 -
 142
142 -
 143
143 -
 144
144 -
 145
145 -
 146
146 -
 147
147 -
 148
148 -
 149
149 -
 150
150 -
 151
151 -
 152
152 -
 153
153 -
 154
154 -
 155
155 -
156
-
157
-
158
-
159
-
160
-
161
-
162
-
163
-
164
-
165
-
166
-
167
-
168
-
169
-
170
-
171
-
172
-
173
-
174
-
175
-
176
-
177
-
178
-
179
-
180
-
181
-
182
-
183
-
184
-
185
-
186
-
187
-
188
-
189
-
190
-
191
-
192
-
193
-
194
-
195
-
196
-
197
-
198
-
199
-
200
-
201
-
202
-
203
-
204
-
205
-
206
-
207
-
208
-
209
-
210
-
211
-
212
-
213
-
214
-
215
-
216
-
217
-
218
-
219
-
220
-
221
-
222
-
223
-
224
-
225
-
226
-
227
-
228
-
229
-
230
-
231
-
232
-
233
-
234
-
235
-
236
-
237
-
238
-
239
-
240
-
241
-
242
-
243
-
244
-
245
-
246
-
247
-
248
-
249
-
250
-
251
-
252
-
253
-
254
-
255
-
256
 |
 |
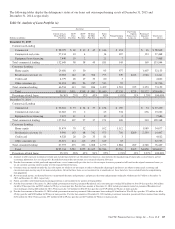
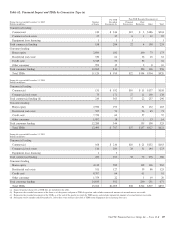
The following tables display the delinquency status of our loans and our nonperforming assets at December 31, 2015 and
December 31, 2014, respectively.
Table 54: Analysis of Loan Portfolio (a)
Accruing
Dollars in millions
Current or Less
Than 30 Days
Past Due
30-59
Days
Past Due
60-89
Days
Past Due
90 Days
Or More
Past Due
Total
Past
Due (b)
Nonperforming
Loans
Fair Value
Option
Nonaccrual
Loans (c)
Purchased
Impaired
Loans
Total Loans
(d) (e)
December 31, 2015
Commercial Lending
Commercial $ 98,075 $ 69 $ 32 $ 45 $ 146 $ 351 $ 36 $ 98,608
Commercial real estate 27,134 10 4 14 187 133 27,468
Equipment lease financing 7,440 19 2 21 7 7,468
Total commercial lending 132,649 98 38 45 181 545 169 133,544
Consumer Lending
Home equity 29,656 63 30 93 977 1,407 32,133
Residential real estate (f) 10,918 142 65 566 773 549 $225 1,946 14,411
Credit card 4,779 28 19 33 80 3 4,862
Other consumer (g) 21,181 180 96 237 513 52 21,746
Total consumer lending 66,534 413 210 836 1,459 1,581 225 3,353 73,152
Total $199,183 $511 $248 $ 881 $1,640 $2,126 $225 $3,522 $206,696
Percentage of total loans 96.36% .25% .12% .43% .80% 1.03% .11% 1.70% 100.00%
December 31, 2014
Commercial Lending
Commercial $ 96,922 $ 73 $ 24 $ 37 $ 134 $ 290 $ 74 $ 97,420
Commercial real estate 22,667 23 2 25 334 236 23,262
Equipment lease financing 7,672 11 1 12 2 7,686
Total commercial lending 127,261 107 27 37 171 626 310 128,368
Consumer Lending
Home equity 31,474 70 32 102 1,112 1,989 34,677
Residential real estate (f) 9,900 163 68 742 973 706 $269 2,559 14,407
Credit card 4,528 28 20 33 81 3 4,612
Other consumer (g) 22,071 214 112 293 619 63 22,753
Total consumer lending 67,973 475 232 1,068 1,775 1,884 269 4,548 76,449
Total $195,234 $582 $259 $1,105 $1,946 $2,510 $269 $4,858 $204,817
Percentage of total loans 95.32% .28% .13% .54% .95% 1.23% .13% 2.37% 100.00%
(a) Amounts in table represent recorded investment and exclude loans held for sale. Recorded investment in a loan includes the unpaid principal balance plus accrued interest and net
accounting adjustments, less any charge-offs. Recorded investment does not include any associated valuation allowance.
(b) Past due loan amounts exclude purchased impaired loans, even if contractually past due (or if we do not expect to receive payment in full based on the original contractual terms), as
we are currently accreting interest income over the expected life of the loans.
(c) Consumer loans accounted for under the fair value option for which we do not expect to collect substantially all principal and interest are subject to nonaccrual accounting and
classification upon meeting any of our nonaccrual policies. Given that these loans are not accounted for at amortized cost, these loans have been excluded from the nonperforming
loan population.
(d) Net of unearned income, net deferred loan fees, unamortized discounts and premiums, and purchase discounts and premiums totaling $1.4 billion and $1.7 billion at December 31,
2015 and December 31, 2014, respectively.
(e) Future accretable yield related to purchased impaired loans is not included in the analysis of loan portfolio.
(f) Past due loan amounts at December 31, 2015 include government insured or guaranteed Residential real estate mortgages totaling $56 million for 30 to 59 days past due, $45 million
for 60 to 89 days past due and $545 million for 90 days or more past due. Past due loan amounts at December 31, 2014 include government insured or guaranteed Residential real
estate mortgages totaling $68 million for 30 to 59 days past due, $43 million for 60 to 89 days past due and $719 million for 90 days or more past due.
(g) Past due loan amounts at December 31, 2015 include government insured or guaranteed Other consumer loans totaling $116 million for 30 to 59 days past due, $75 million for 60 to
89 days past due and $220 million for 90 days or more past due. Past due loan amounts at December 31, 2014 include government insured or guaranteed Other consumer loans totaling
$152 million for 30 to 59 days past due, $93 million for 60 to 89 days past due and $277 million for 90 days or more past due.
The PNC Financial Services Group, Inc. – Form 10-K 127